COX3, ND1, reactive oxygen species, and the path from colitis to colorectal cancer
mitochondria
colitis
colorectal cancer
oxidative stress
biomarkers
How inflammation-driven mitochondrial turnover can amplify mtDNA damage, sustain colitis, and reshape cancer risk.
Author
Methylation & Colitis team
Published
August 25, 2026
An inflamed epithelial cell can make more mitochondria while extracting less useful energy from each one. That apparent paradox matters because respiratory-chain stress is not only a consequence of inflammation: it can become an amplifier. Higher mitochondrial turnover and electron flow create more opportunities for reactive oxygen species (ROS) to damage mitochondrial DNA (mtDNA), weaken oxidative phosphorylation (OXPHOS), and release signals that keep mucosal immunity active. Over years of repeated injury and repair, that loop can help create a tissue environment permissive to colitis-associated colorectal cancer.
Mitochondrial biogenesis in inflammation
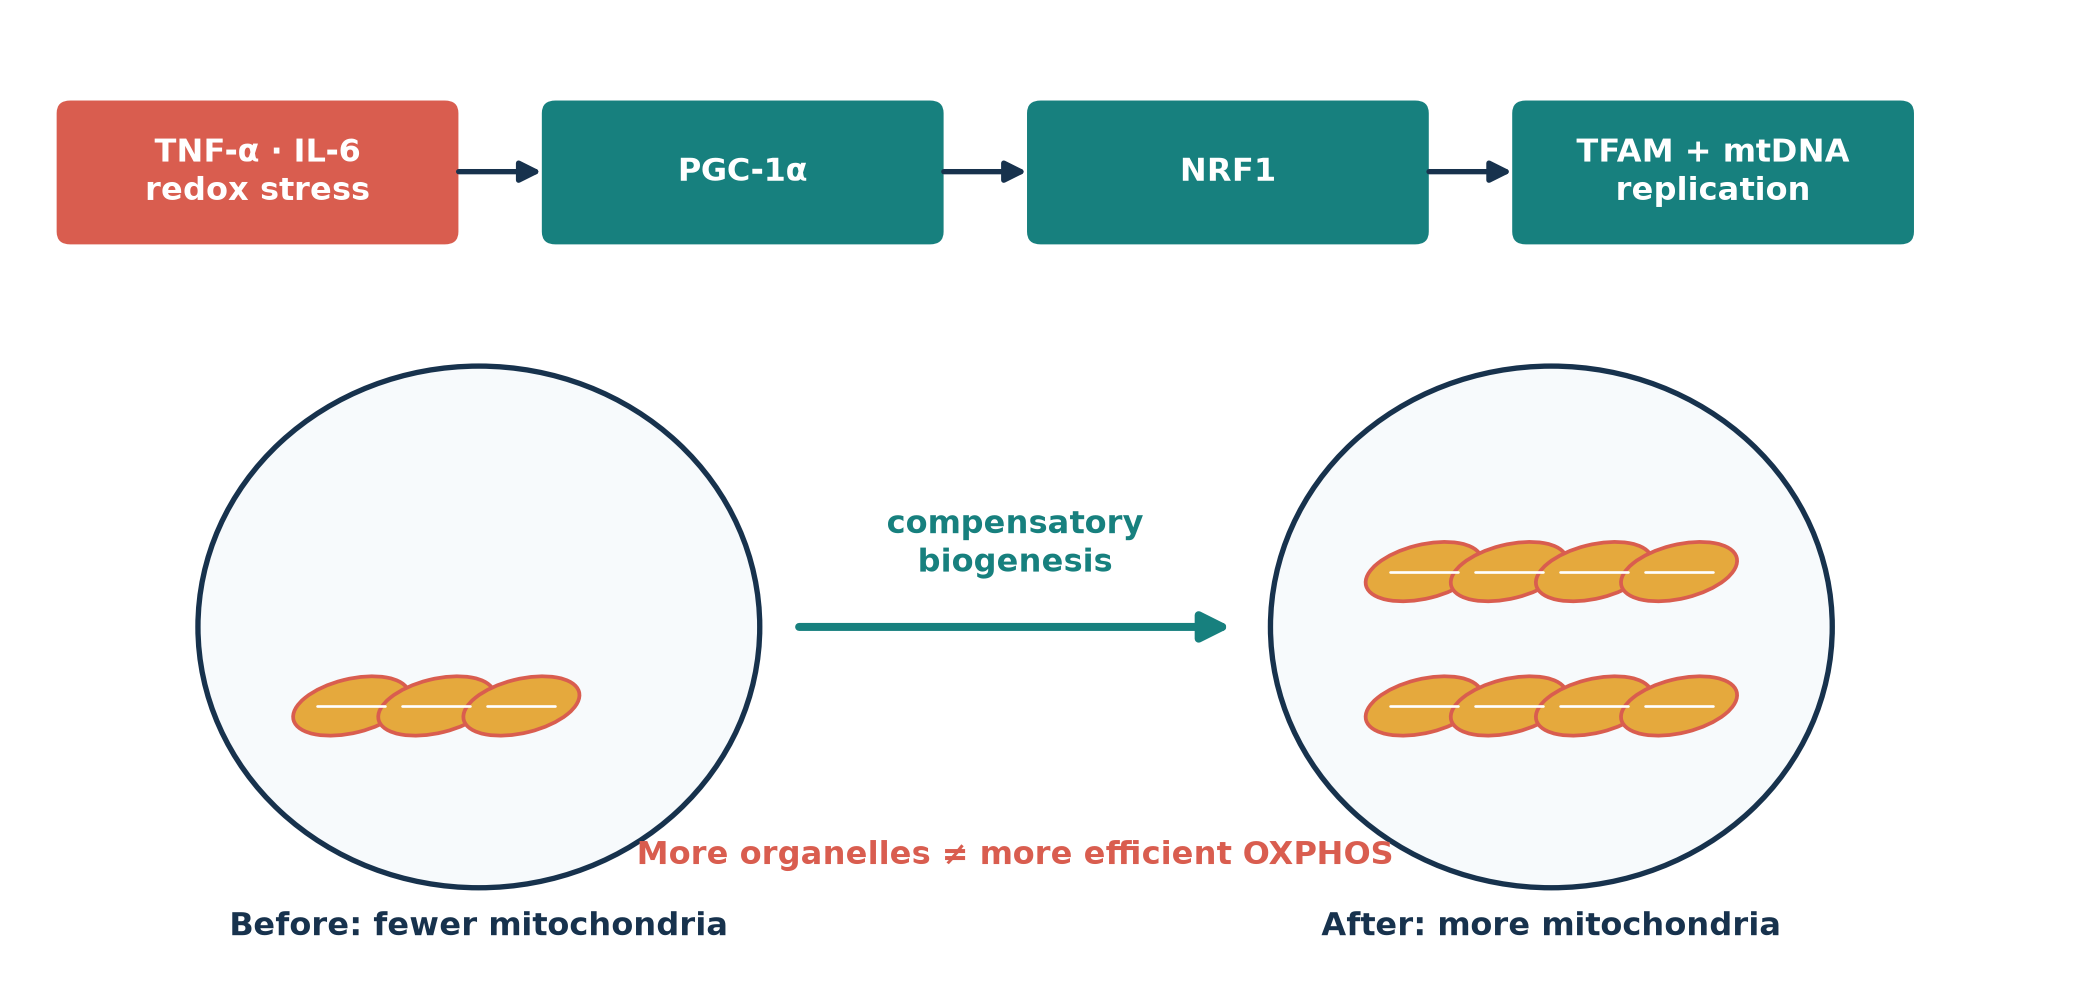
Mitochondrial biogenesis is coordinated rather than spontaneous. PGC-1α coactivates nuclear respiratory factors including NRF1; these induce TFAM and other proteins needed to replicate, package, and transcribe mtDNA. Inflammatory and redox signals can engage this repair-and-replacement program, although cytokines such as TNF-α and IL-6 can also suppress or distort it depending on dose, timing, cell type, and disease stage. Thus, biogenesis is better understood as a stress response than as proof of healthy respiration (Cherry and Piantadosi, 2015; Cunningham, Vincent, Sodhi, Novak, Ranganathan, Egan, Stolz, Rogers, Firek, Morowitz, Gittes, Zuckerbraun, Hackam, and Mollen, 2016). Figure 1 shows the compensatory logic.
Show reproducible Python code
from pathlib import Pathimport numpy as npimport pandas as pdimport matplotlib.pyplot as pltimport seaborn as snsfrom matplotlib.patches import Circle, Ellipse, FancyBboxPatch, FancyArrowPatch, Rectanglefrom scipy import statsOUT = Path("images")OUT.mkdir(exist_ok=True)sns.set_theme(style="whitegrid", context="notebook")navy, teal, coral, gold, pale ="#17324D", "#17807E", "#D95D4F", "#E5A93D", "#EAF3F2"fig, ax = plt.subplots(figsize=(11, 5.3))ax.set(xlim=(0, 12), ylim=(0, 6)); ax.axis("off")steps = [(0.3, 4.65, 2.2, 0.75, "TNF-α · IL-6\nredox stress", coral), (3.15, 4.65, 2.2, 0.75, "PGC-1α", teal), (6.0, 4.65, 2.2, 0.75, "NRF1", teal), (8.85, 4.65, 2.2, 0.75, "TFAM + mtDNA\nreplication", teal)]for x, y, w, h, txt, col in steps: ax.add_patch(FancyBboxPatch((x,y),w,h,boxstyle="round,pad=.08",fc=col,ec="none")) ax.text(x+w/2,y+h/2,txt,ha="center",va="center",color="white",weight="bold")for x in [2.55,5.4,8.25]: ax.add_patch(FancyArrowPatch((x,5.03),(x+.55,5.03),arrowstyle="-|>",mutation_scale=16,color=navy,lw=2))for cx, label, count in [(2.7,"Before: fewer",3),(9.0,"After: more",8)]: ax.add_patch(Circle((cx,2.15),1.65,fc="#F7FAFC",ec=navy,lw=2)) coords = [(cx-0.75+(i%4)*0.5,1.65+(i//4)*0.85) for i inrange(count)]for mx,my in coords: ax.add_patch(Ellipse((mx,my),.7,.34,angle=15,fc=gold,ec=coral,lw=1.4)) ax.plot([mx-.2,mx+.2],[my,my],color="white",lw=1) ax.text(cx,.2,label+" mitochondria",ha="center",weight="bold",color=navy)ax.add_patch(FancyArrowPatch((4.55,2.15),(7.15,2.15),arrowstyle="-|>",mutation_scale=22,color=teal,lw=3))ax.text(5.85,2.5,"compensatory\nbiogenesis",ha="center",color=teal,weight="bold")ax.text(5.85,.65,"More organelles ≠ more efficient OXPHOS",ha="center",color=coral,weight="bold")fig.tight_layout(); fig.savefig(OUT/"figure-1-biogenesis.png",dpi=220,bbox_inches="tight")plt.show()
Figure 1: Inflammatory signaling can engage the PGC-1α–NRF1–TFAM biogenesis program, increasing mitochondrial number without guaranteeing respiratory quality.
Why COX3 and ND1 are vulnerable
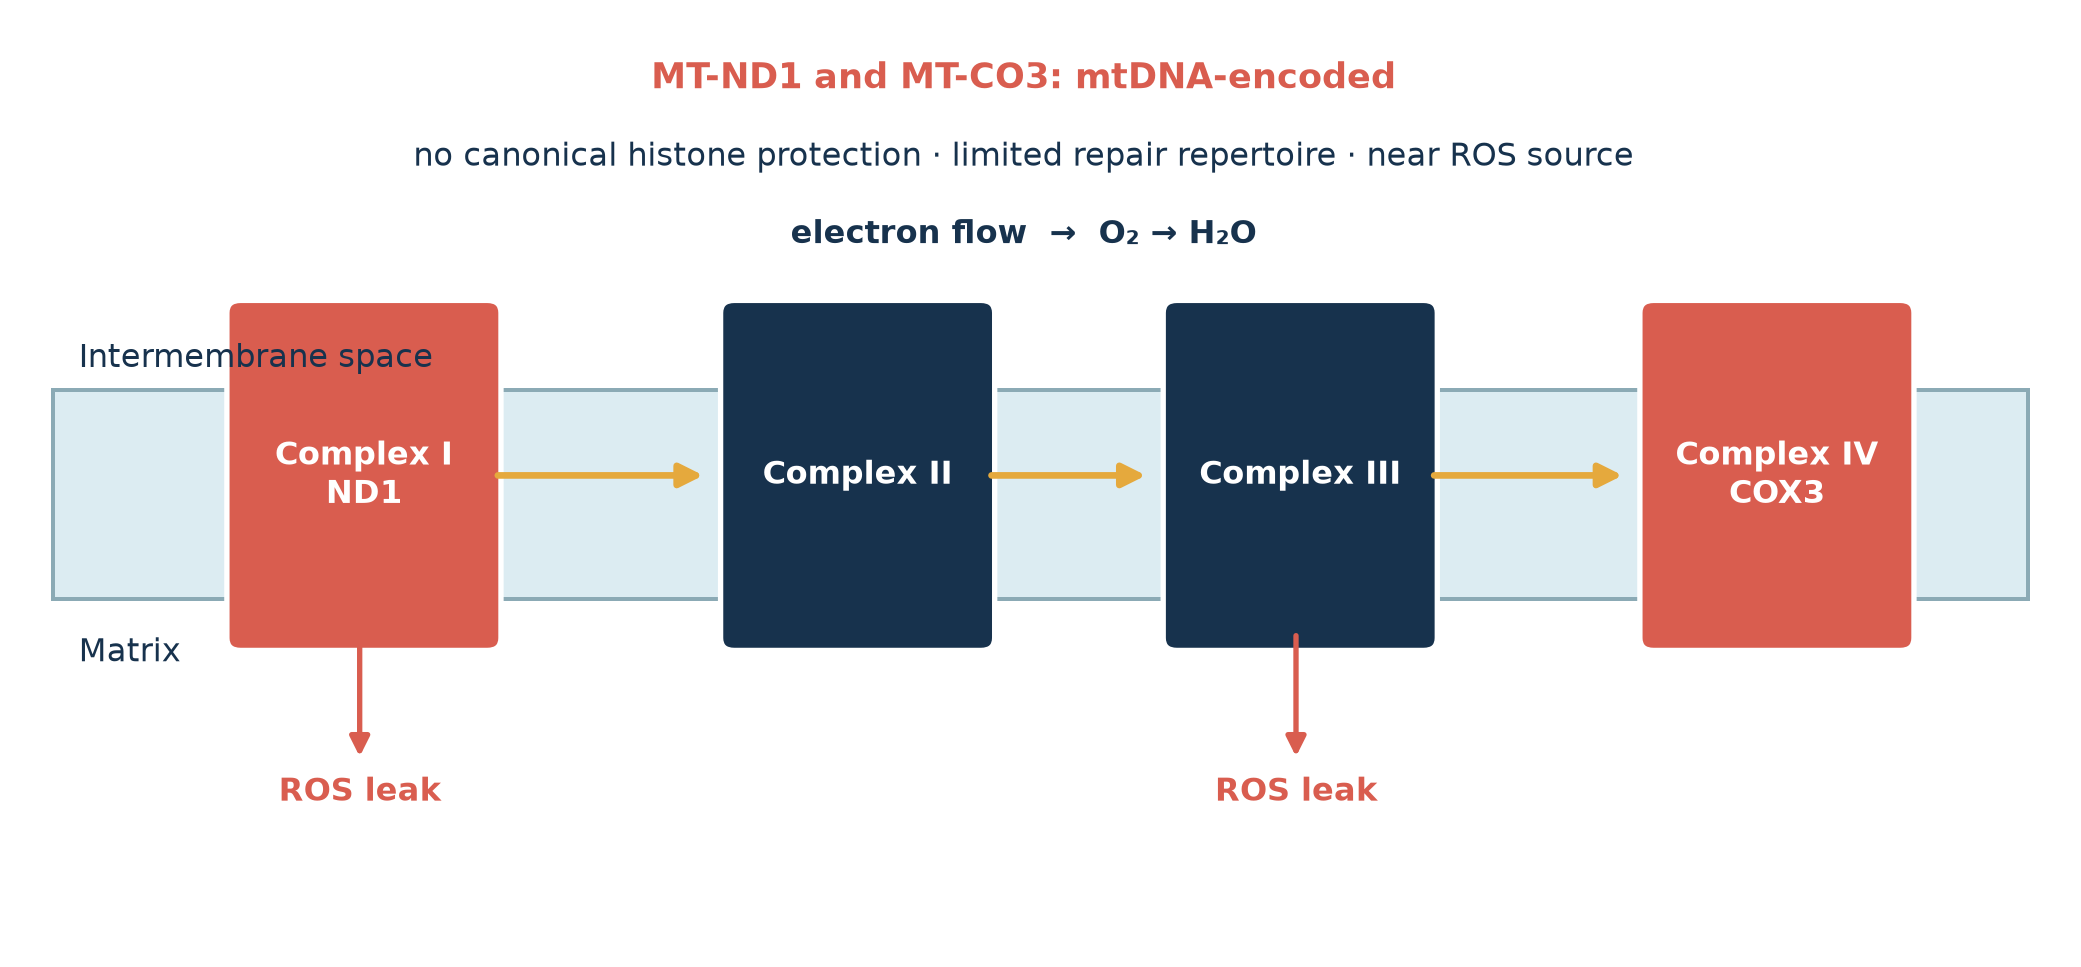
MT-ND1 encodes a core membrane subunit of Complex I, where electrons enter from NADH; MT-CO3 encodes cytochrome-c-oxidase subunit III in Complex IV, where oxygen is reduced. Both genes reside on the compact mitochondrial genome. Compared with nuclear DNA, mtDNA is not organized in canonical histone chromatin, has a narrower repair repertoire, and lies close to respiratory ROS production. Those features make oxidative lesions and replication errors consequential, but not uniquely confined to these two genes: COX3 and ND1 are mechanistically useful sentinels within a genome-wide vulnerability (Nishikawa, Oshitani, Matsumoto, Nishigami, Arakawa, and Inoue, 2005; Turrens, 2003). Their ETC positions are highlighted in Figure 2.
Show reproducible Python code
fig, ax = plt.subplots(figsize=(11,5.2)); ax.set(xlim=(0,12),ylim=(0,6)); ax.axis("off")ax.add_patch(Rectangle((.2,2.25),11.6,1.35,fc="#DCECF2",ec="#8BAAB5",lw=1.5))ax.text(.35,3.75,"Intermembrane space",color=navy); ax.text(.35,1.85,"Matrix",color=navy)xs=[1.3,4.2,6.8,9.6]; labels=["Complex I\nND1","Complex II","Complex III","Complex IV\nCOX3"]for x,lbl inzip(xs,labels): hi = x in (1.3,9.6) ax.add_patch(FancyBboxPatch((x,2.0),1.45,2.1,boxstyle="round,pad=.08",fc=coral if hi else navy,ec="white",lw=2)) ax.text(x+.725,3.05,lbl,ha="center",va="center",color="white",weight="bold")for a,b in [(2.78,4.05),(5.68,6.65),(8.28,9.45)]: ax.add_patch(FancyArrowPatch((a,3.05),(b,3.05),arrowstyle="-|>",mutation_scale=18,color=gold,lw=2.5))ax.text(5.9,4.55,"electron flow → O₂ → H₂O",ha="center",color=navy,weight="bold")for x in [2.0,7.5]: ax.add_patch(FancyArrowPatch((x,2.05),(x,1.2),arrowstyle="-|>",mutation_scale=15,color=coral,lw=2)) ax.text(x,0.95,"ROS leak",ha="center",color=coral,weight="bold")ax.text(5.9,5.55,"MT-ND1 and MT-CO3: mtDNA-encoded",ha="center",fontsize=13,color=coral,weight="bold")ax.text(5.9,5.05,"no canonical histone protection · limited repair repertoire · near ROS source",ha="center",color=navy)fig.tight_layout(); fig.savefig(OUT/"figure-2-etc.png",dpi=220,bbox_inches="tight"); plt.show()
Figure 2: Electron flow through the inner mitochondrial membrane. MT-ND1 in Complex I and MT-CO3 in Complex IV are mtDNA-encoded; ROS leakage is shown at the principal Complex I and III sites.
The ROS feedback loop
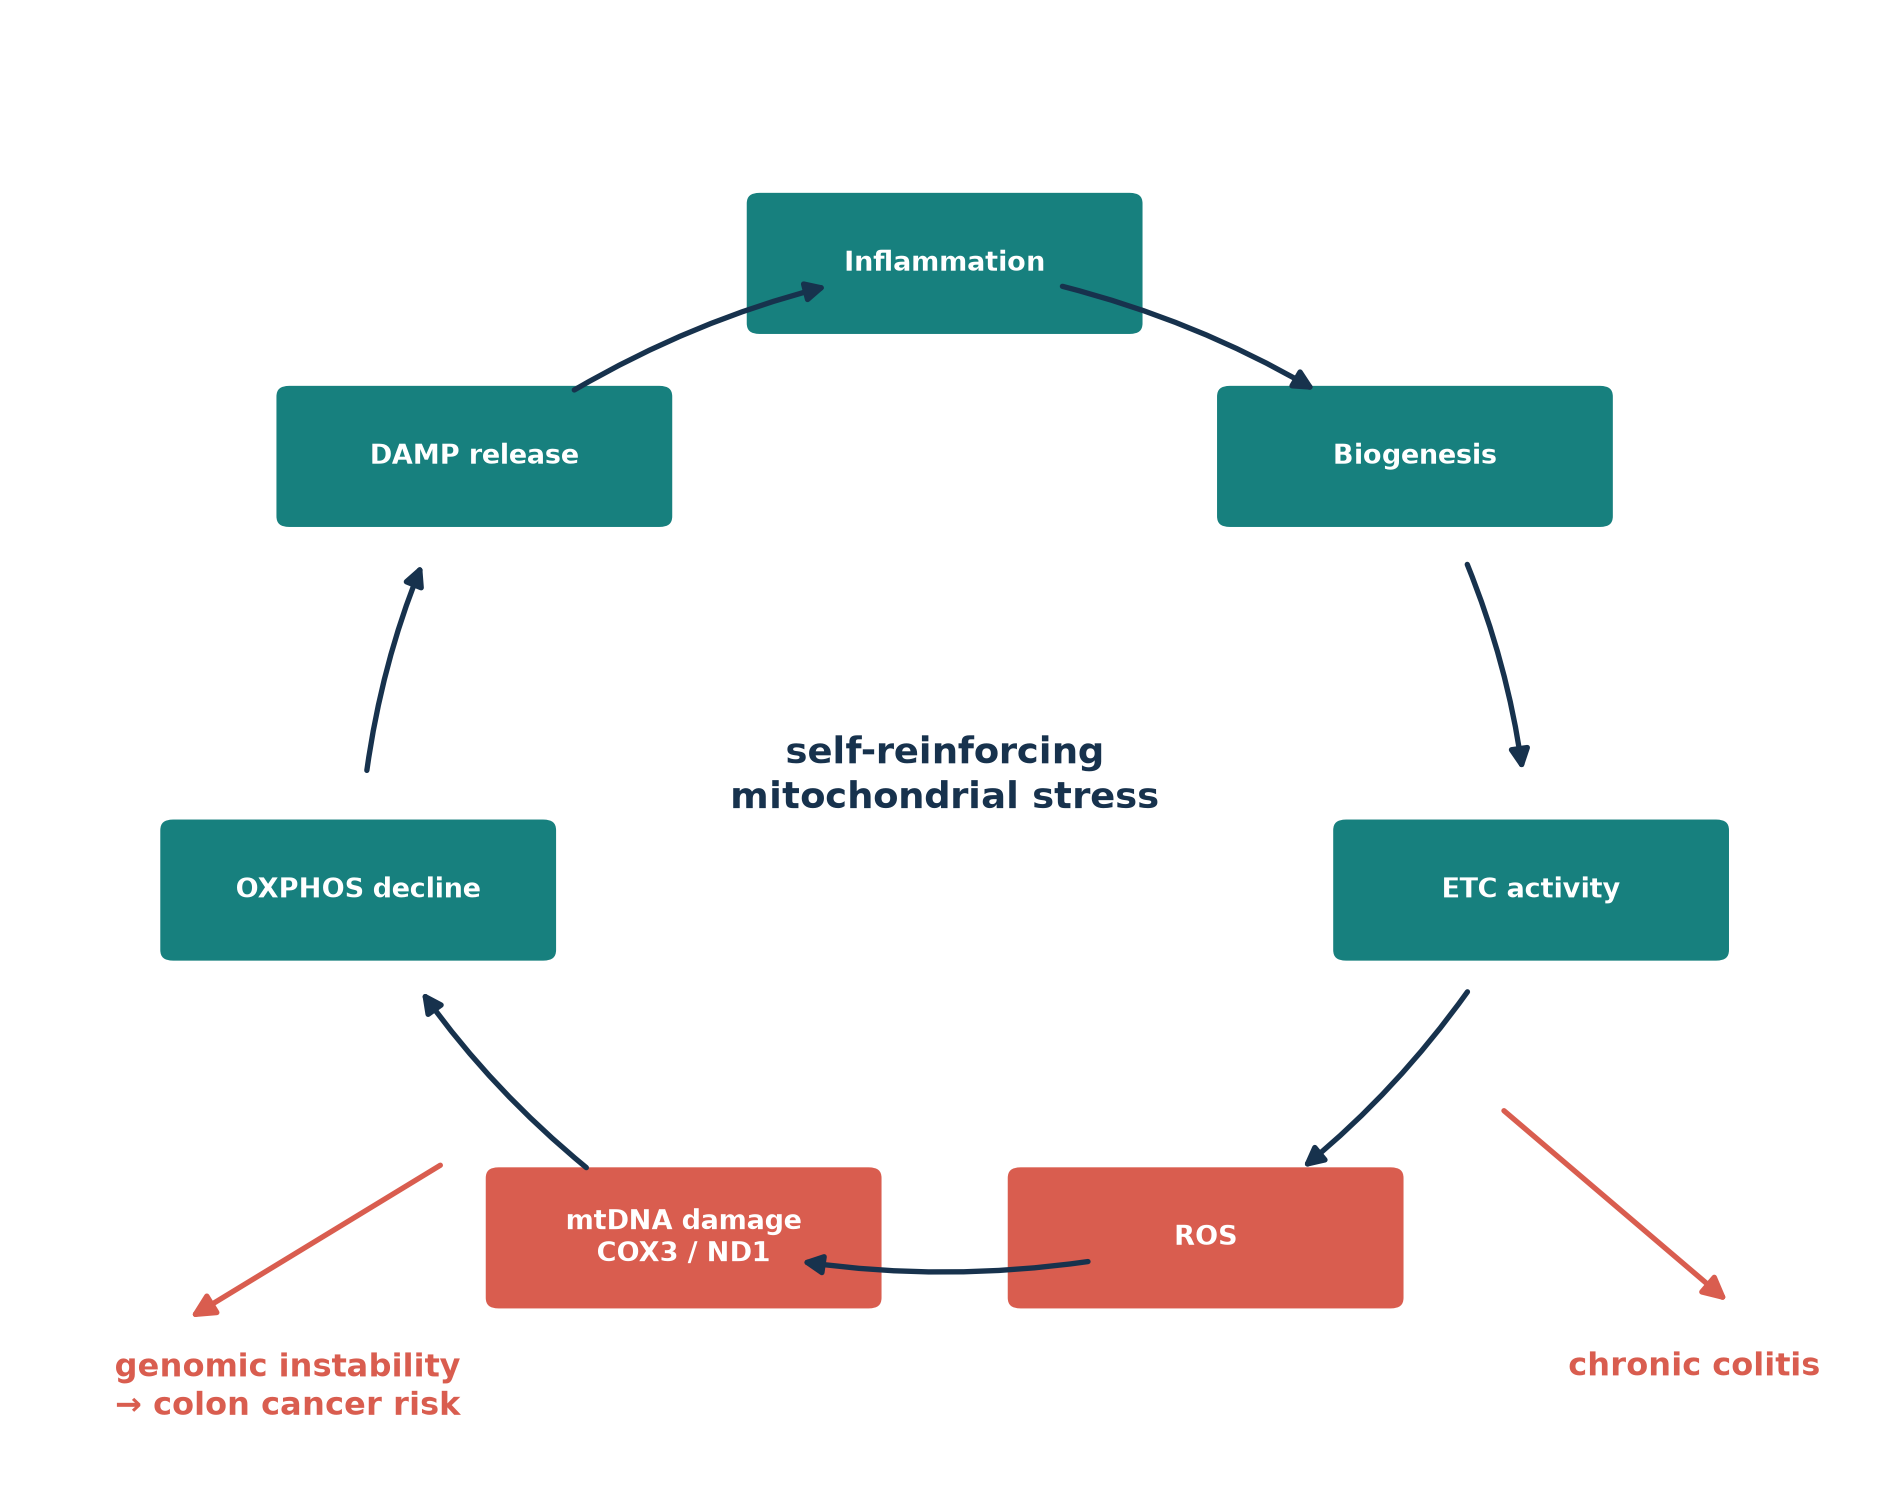
Greater ETC throughput can raise electron leakage, especially when respiratory complexes are damaged or substrate supply exceeds downstream capacity. ROS then damage mtDNA, including MT-CO3 and MT-ND1; dysfunctional complexes lower coupling efficiency and can generate still more ROS. Permeabilized or dying cells release mtDNA and mitochondrial formyl peptides, adding immune stimulation to metabolic failure (Turrens, 2003; Boyapati, Dorward, Tamborska, Kalla, Ventham, Doherty, Whitfield, Gray, Loane, Rossi, Satsangi, and Ho, 2018). This is the cycle summarized in Figure 3. It is a plausible integrated mechanism, not proof that every arrow occurs in every cell at every stage.
Figure 3: A proposed feed-forward loop linking inflammation, mitochondrial turnover, respiratory stress, DAMP release, chronic colitis, and cancer risk.
Link to colitis
The intestinal epithelium depends heavily on mitochondrial metabolism to maintain ion transport, mucus production, tight-junction renewal, and rapid repair. Respiratory dysfunction therefore weakens the barrier while inflammatory infiltrates increase oxidant exposure. Released mtDNA, with bacterial-like CpG motifs, can signal through TLR9; cytosolic oxidized mtDNA can also promote NLRP3 inflammasome activation. Mitochondrial formyl peptides recruit and activate innate immune cells. In active IBD, plasma and fecal mtDNA, circulating formyl peptides, damaged mucosal mitochondria, and TLR9-positive lamina propria cells have all been observed together, supporting—without by itself proving—a self-sustaining DAMP circuit (Boyapati, Dorward, Tamborska, Kalla, Ventham, Doherty, Whitfield, Gray, Loane, Rossi, Satsangi, and Ho, 2018).
Direct evidence from OXPHOS protein studies
Schneider et al. examined 286 colonic biopsies from 124 pediatric and adult participants with Crohn’s disease, ulcerative colitis, or no IBD. Immunohistochemistry measured representative subunits from all five OXPHOS complexes plus VDAC1 as a marker of mitochondrial mass. Inflamed IBD mucosa showed disease-, age-, and compartment-dependent changes, including reduced epithelial respiratory-complex staining and altered VDAC1. This is unusually direct tissue-level evidence that respiratory machinery and mitochondrial mass change in inflamed colon (Schneider, Özsoy, Zimmermann, Brunner, Feichtinger, Mayr, Kofler, Neureiter, Klieser, Aigner, Schütz, Stummer, Sperl, and Weghuber, 2022). It complements sequencing studies, which identify mtDNA alterations but generally infer rather than directly measure respiratory protein function. Earlier biochemical work likewise reported ETC-complex dysfunction in UC mucosa (Santhanam, Rajamanickam, Motamarry, Ramakrishna, Amirtharaj, Ramachandran, Pulimood, and Venkatraman, 2012).
Every number below is simulated for pedagogical illustration. None comes from a patient, clinical cohort, GEO record, or the cited studies; the simulations reproduce only broad qualitative patterns and cannot estimate biological effect sizes.
Relative mtDNA copy number
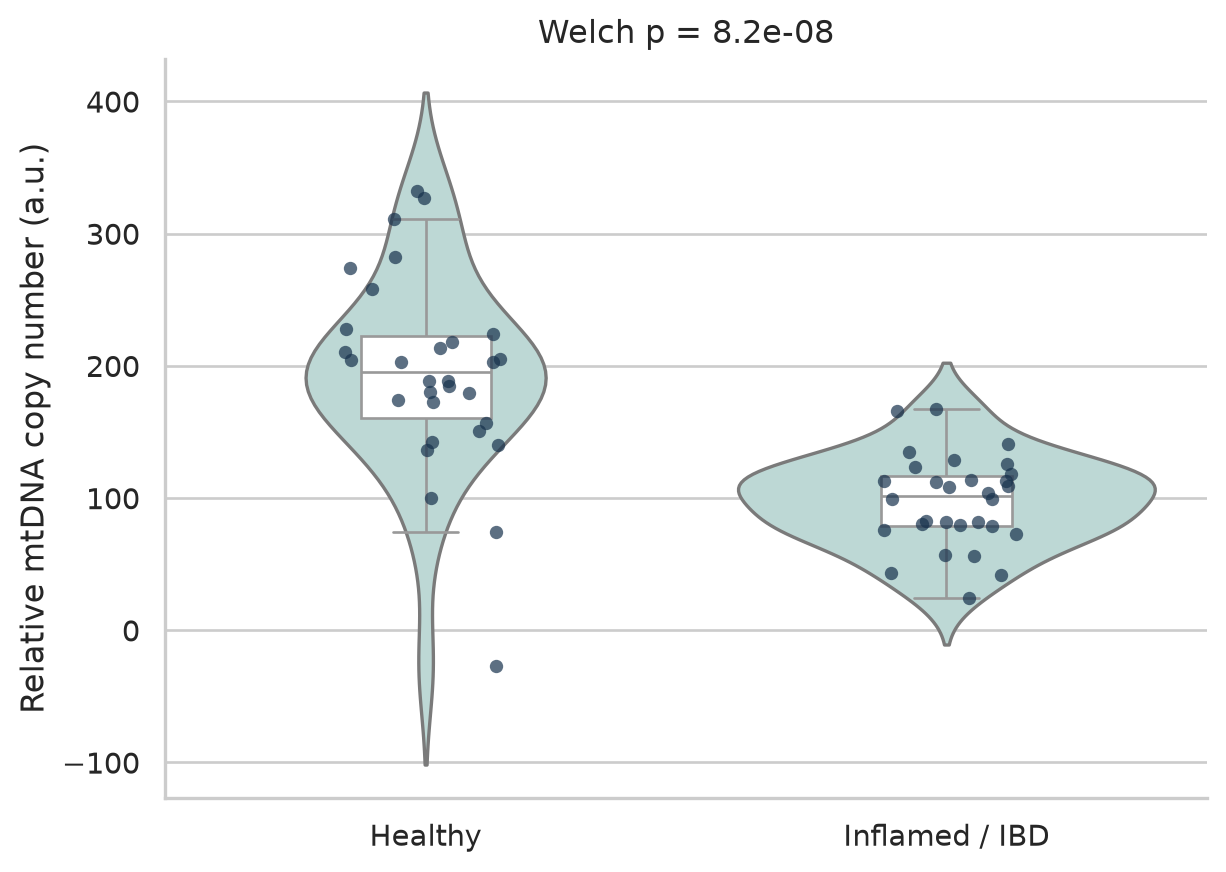
This two-group simulation follows the requested means and variances and is loosely motivated by the heterogeneous mtDNA-copy-number/IBD literature, including causal-inference evidence in Crohn’s disease (Cai, Li, Liang, Zhang, Xu, Dong, Weng, and Yu, 2023). Tissue injury can deplete mtDNA even when surviving cells activate compensatory biogenesis, so direction depends on specimen, cell mixture, timing, and normalization.
Show reproducible Python code
rng = np.random.default_rng(20260825)copy = pd.DataFrame({"group": np.repeat(["Healthy", "Inflamed / IBD"], 30),"mtDNA_copy_number": np.r_[rng.normal(205,70,30), rng.normal(95,30,30)]})t_copy, p_copy = stats.ttest_ind(copy.loc[copy.group=="Healthy","mtDNA_copy_number"], copy.loc[copy.group=="Inflamed / IBD","mtDNA_copy_number"], equal_var=False)print(f"Welch t = {t_copy:.2f}; p = {p_copy:.3g}")fig, ax = plt.subplots(figsize=(7,5))sns.violinplot(data=copy,x="group",y="mtDNA_copy_number",inner=None,color="#B9DCD8",ax=ax)sns.boxplot(data=copy,x="group",y="mtDNA_copy_number",width=.25,showfliers=False,color="white",ax=ax)sns.stripplot(data=copy,x="group",y="mtDNA_copy_number",color=navy,alpha=.7,jitter=.16,size=5,ax=ax)ax.set(xlabel="",ylabel="Relative mtDNA copy number (a.u.)",title=f"Welch p = {p_copy:.2g}")sns.despine(); plt.show()
Welch t = 6.50; p = 8.17e-08
Figure 4: Simulated relative mtDNA copy number in healthy and inflamed colon (n = 30 per group). Points are synthetic.
In this synthetic draw, inflamed tissue has lower relative mtDNA copy number (Welch p reported above), illustrating depletion despite a possible compensatory biogenesis signal.
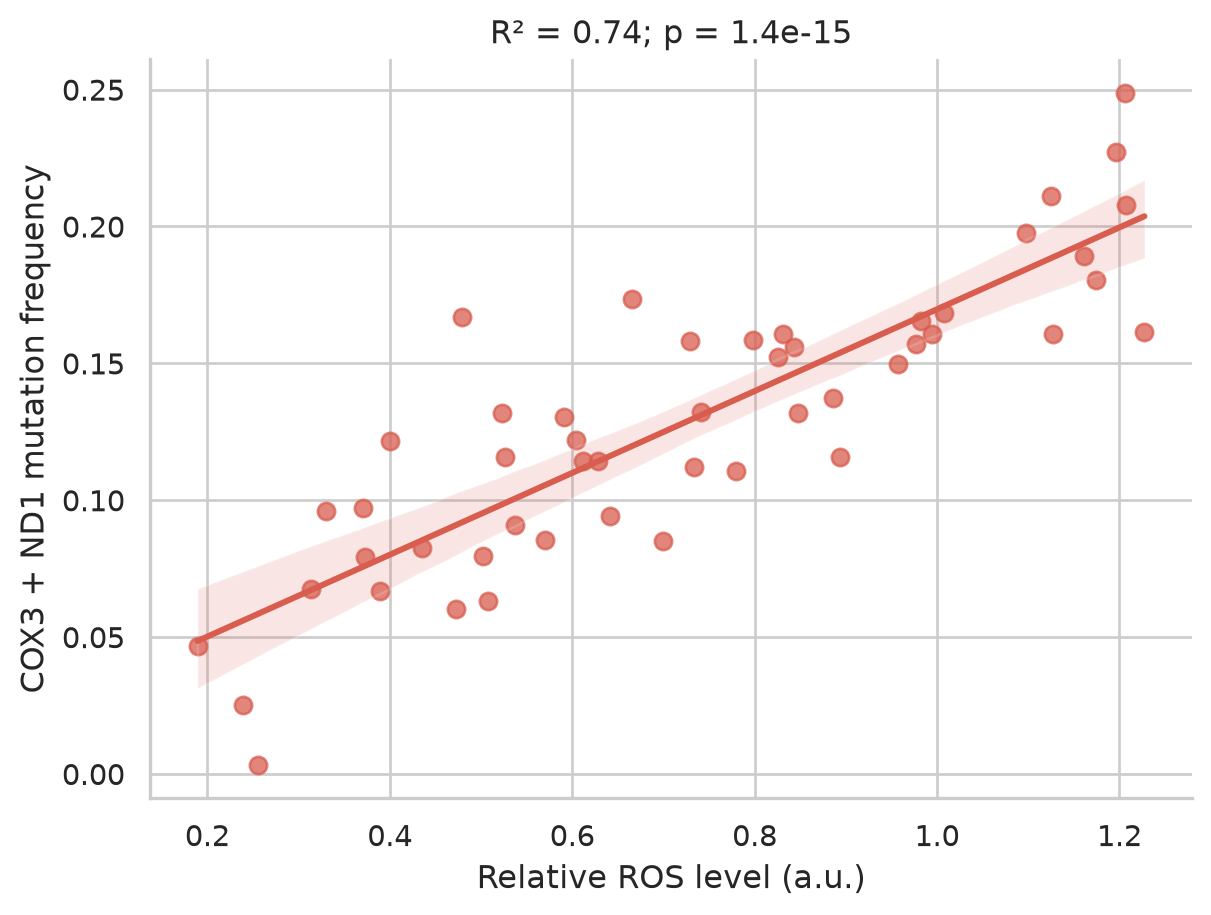
Figure 5: Simulated ROS level versus combined COX3/ND1 mutation frequency (n = 50), with ordinary least-squares fit and 95% confidence band.
The simulated regression is positive, as constructed; it demonstrates how correlation and uncertainty would be displayed, not a measured dose-response.
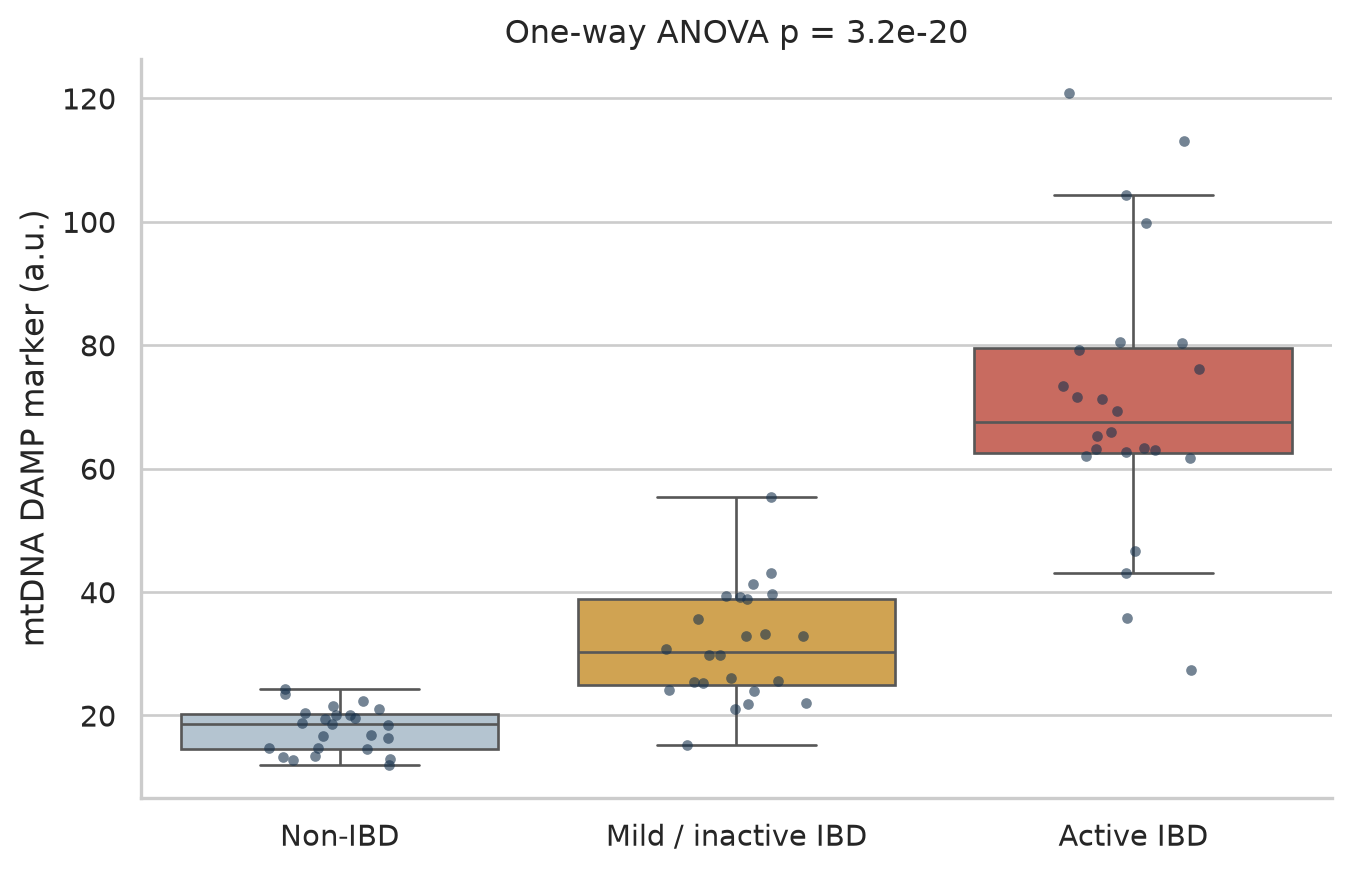
groups = ["Non-IBD", "Mild / inactive IBD", "Active IBD"]damp = pd.DataFrame({"group":np.repeat(groups,24), "mtDNA_DAMP":np.r_[rng.normal(18,4,24),rng.normal(31,8,24),rng.normal(62,20,24)]})samples=[damp.loc[damp.group==g,"mtDNA_DAMP"] for g in groups]f_damp,p_damp=stats.f_oneway(*samples)print(f"One-way ANOVA F = {f_damp:.2f}; p = {p_damp:.3g}")fig, ax = plt.subplots(figsize=(8,5))sns.boxplot(data=damp,x="group",y="mtDNA_DAMP",hue="group",palette=["#AFC5D5",gold,coral],legend=False,showfliers=False,ax=ax)sns.stripplot(data=damp,x="group",y="mtDNA_DAMP",color=navy,alpha=.6,jitter=.18,size=4,ax=ax)ax.set(xlabel="",ylabel="mtDNA DAMP marker (a.u.)",title=f"One-way ANOVA p = {p_damp:.2g}")sns.despine(); plt.show()
One-way ANOVA F = 92.22; p = 3.21e-20
Figure 6: Simulated mtDNA DAMP marker across non-IBD, mild/inactive IBD, and active IBD groups (n = 24 each).
The synthetic group difference increases with activity and variance, matching the intended illustration rather than estimating a clinical threshold.
Emerging methods: EM-seq as a future tool
Enzymatic methyl-sequencing (EM-seq) measures cytosine methylation; it is not a mutation assay and therefore is not a direct extension of COX3/ND1 mutation-biomarker studies. Traditional bisulfite conversion is harsh, fragments DNA, and can bias recovery and mapping—problems that are particularly relevant to low-input, low-methylation mtDNA. EM-seq uses milder enzymatic conversion and preserves more usable molecules (Vaisvila, Ponnaluri, Sun, and others, 2021). Targeted plasma cfDNA EM-seq has already supported an HCC classifier in 596 samples, based on nuclear differentially methylated CpGs (Guo, Zheng, Li, Li, Xiao, Zheng, Zhu, Xu, He, Zhang, Chen, Qiu, Jiang, Liu, and Chen, 2023). Applying it specifically to mitochondrial methylation in plasma from colitis or CRC is promising but forward-looking: to our knowledge, no published study has yet established that application.
Anne D. Cherry and Claude A. Piantadosi. (2015). Regulation of mitochondrial biogenesis and its intersection with inflammatory responses. Antioxidants & Redox Signaling. https://doi.org/10.1089/ars.2014.6200.
Katie E. Cunningham, Gabriel Vincent, Chhinder P. Sodhi, Elizabeth A. Novak, S. Ranganathan, Christine E. Egan, Donna B. Stolz, Martha B. Rogers, Brian Firek, Michael J. Morowitz, George K. Gittes, Brian S. Zuckerbraun, David J. Hackam, and Kevin P. Mollen. (2016). Peroxisome proliferator-activated receptor-\(\gamma\) coactivator 1-\(\alpha\) (PGC1\(\alpha\)) protects against experimental murine colitis. Journal of Biological Chemistry. https://doi.org/10.1074/jbc.M115.688812.
Masanori Nishikawa, Nobuhide Oshitani, Tetsuya Matsumoto, Takahiro Nishigami, Tetsuo Arakawa, and Masayasu Inoue. (2005). Accumulation of mitochondrial DNA mutation with colorectal carcinogenesis in ulcerative colitis. British Journal of Cancer. https://doi.org/10.1038/sj.bjc.6602664.
Ray K. Boyapati, David A. Dorward, Arina Tamborska, Rahul Kalla, Nicholas T. Ventham, Michael K. Doherty, Phil D. Whitfield, Mohini Gray, Jason Loane, Adriano G. Rossi, Jack Satsangi, and Gwo-Tzer Ho. (2018). Mitochondrial DNA is a pro-inflammatory damage-associated molecular pattern released during active IBD. Inflammatory Bowel Diseases. https://doi.org/10.1093/ibd/izy095.
Anna M. Schneider, Mihriban Özsoy, Franz A. Zimmermann, Susanne M. Brunner, René G. Feichtinger, Johannes A. Mayr, Barbara Kofler, Daniel Neureiter, Eckhard Klieser, Elmar Aigner, Sebastian Schütz, Nathalie Stummer, Wolfgang Sperl, and Daniel Weghuber. (2022). Expression of oxidative phosphorylation complexes and mitochondrial mass in pediatric and adult inflammatory bowel disease. Mediators of Inflammation. https://doi.org/10.1155/2022/9151169.
Srikanth Santhanam, Sankar Rajamanickam, Aditya Motamarry, B. S. Ramakrishna, J. G. Amirtharaj, A. Ramachandran, Anna Pulimood, and Anuradha Venkatraman. (2012). Mitochondrial electron transport chain complex dysfunction in the colonic mucosa in ulcerative colitis. Inflammatory Bowel Diseases. https://doi.org/10.1002/ibd.22926.
Guoping Sui, Shaoyu Zhou, Jean Wang, Marcia Canto, Edward E. Lee, James R. Eshleman, Elizabeth A. Montgomery, David Sidransky, Joseph A. Califano, and Anirban Maitra. (2006). Mitochondrial DNA mutations in preneoplastic lesions of the gastrointestinal tract: A biomarker for the early detection of cancer. Molecular Cancer. https://doi.org/10.1186/1476-4598-5-73.
Yong Xu, Jing Zhou, Qing Yuan, Jin Su, Qiang Li, Xin Lu, Lin Zhang, Zhe Cai, and Jing Han. (2021). Quantitative detection of circulating MT-ND1 as a potential biomarker for colorectal cancer. Bosnian Journal of Basic Medical Sciences. https://doi.org/10.17305/bjbms.2021.5576.
Danny N. Legge, Tracey J. Collard, Ewelina Stanko, Ashley J. Hoskin, Amy K. Holt, Caroline J. Bull, Madhu Kollareddy, Jake Bellamy, Sarah Groves, Eric H. Ma, Emma Hazelwood, David Qualtrough, Borko Amulic, Karim Malik, Ann C. Williams, Nicholas Jones, and Emma E. Vincent. (2024). Identifying targetable metabolic dependencies across colorectal cancer progression. Molecular Metabolism. https://doi.org/10.1016/j.molmet.2024.102037.
Corti Denise, Paolo Paoli, Maura Calvani, Maria Letizia Taddei, Elisa Giannoni, Scott Kopetz, Syed Mohammad Ali Kazmi, Maria Pia Morelli, Piergiorgio Pettazzoni, Elena Sacco, Anna Caselli, Marco Vanoni, Matteo Landriscina, Paolo Cirri, and Paola Chiarugi. (2015). 5-fluorouracil resistant colon cancer cells are addicted to OXPHOS to survive and enhance stem-like traits. Oncotarget. https://doi.org/10.18632/oncotarget.5991.
Kelsey T. Baker, Deborah Nachmanson, Sumeet Kumar, Mary J. Emond, Cemal Ussakli, Teresa A. Brentnall, Scott R. Kennedy, and Rosa A. Risques. (2019). Mitochondrial DNA mutations are associated with ulcerative colitis preneoplasia but tend to be negatively selected in cancer. Molecular Cancer Research. https://doi.org/10.1158/1541-7786.MCR-18-0520.
Xianlei Cai, Xueying Li, Chao Liang, Miaozun Zhang, Yuan Xu, Zhebin Dong, Yihui Weng, and Weiming Yu. (2023). Mitochondrial DNA copy number is associated with crohn’s disease: A comprehensive mendelian randomization analysis. Scientific Reports. https://doi.org/10.1038/s41598-023-48175-5.
Romualdas Vaisvila, Vamsi K. C. Ponnaluri, Zhe Sun, and others. (2021). Enzymatic methyl sequencing detects DNA methylation at single-base resolution from picograms of DNA. Genome Research. https://doi.org/10.1101/gr.266551.120.
Ping Guo, Hailing Zheng, Yihan Li, Yuntong Li, Yue Xiao, Jin Zheng, Xingqiang Zhu, Huan Xu, Zhi He, Qian Zhang, Jinchun Chen, Mingshan Qiu, Min Jiang, Pingguo Liu, and Hongliang Chen. (2023). Hepatocellular carcinoma detection via targeted enzymatic methyl sequencing of plasma cell-free DNA. Clinical Epigenetics. https://doi.org/10.1186/s13148-022-01420-6.