From gene list to pathway neighborhoods

A Reactome-guided map of inflammation, barrier failure, and colitis-associated colorectal cancer

Reactome
pathways
ulcerative colitis
colorectal cancer
gene networks
How the project’s 14 candidate genes connect—and where Reactome correctly leaves gaps.
Author

Methylation & Colitis team

Published

August 25, 2026

A gene list becomes biologically useful when it is reorganized into processes: immune activation, immune restraint, epithelial cohesion, damage sensing, and escape from cell-cycle control. Reactome helps with that reorganization because it represents curated reactions and pathway hierarchies rather than associations inferred from co-expression alone (Milacic, Beavers, Conley, and others, 2024). But it also exposes an important limitation: several of the most interesting methylation candidates are poorly characterized and do not yet have direct curated Reactome pathways.

NoteWhat this analysis is—and is not

The Reactome mappings were queried on 25 August 2026 with HGNC symbols, projection to human, and interactors disabled. The disease-stage scores below are qualitative hypotheses synthesized from the cited tissue literature; they are not patient measurements, differential-expression results, or pathway-enrichment p-values.

The 14-gene panel

The panel combines immune genes that were reported as hypomethylated in severe UC (CD86, IL10, NLRC4, NLRP3, SIGLEC5, CLMP) with promoter-hypermethylated or neoplasia-marker candidates (FAM217B, KIAA1614, RIBC2, FOXE1, SYNE1) and established epithelial/cancer-relevant genes (CDH1, CDKN2A, GDNF) (Kang, Bae, Han, Kim, Kim, and Yi, 2016; Papadia, Louwagie, Del Rio, Grooteclaes, Coruzzi, Montana, Novelli, Bordi, de’ Angelis, Bassett, Bigley, Warren, Atkin, and Forbes, 2014; Saito, Kato, Hiraoka, Horii, Suzuki, Higashi, Kaji, Kondo, and Yamamoto, 2011). These are not interchangeable signals: some are pathway components, some are tissue markers, and some remain mechanistically under-annotated.

Reactome coverage is uneven—and informative

Direct queries returned curated neighborhoods for nine genes. Examples include CD28/CTLA-4 and IL-10 signaling for CD86; CDH1 transcription, translation, and adherens-junction organization; oncogene- and oxidative-stress-induced senescence for CDKN2A; RET/NCAM signaling for GDNF; the IPAF inflammasome for NLRC4; the NLRP3 inflammasome; and neutrophil degranulation for SIGLEC5. SYNE1 mapped to meiotic synapsis, a real annotation but not an obvious colon mechanism. CLMP, FAM217B, FOXE1, KIAA1614, and RIBC2 were not directly mapped by this identifier analysis.

Figure 1 makes that asymmetry visible. “Limited” does not mean unimportant: it means the database does not support a direct reaction-level bridge for the submitted symbol under these settings.

Show reproducible Python code
fig, ax = plt.subplots(figsize=(10,7))
sns.heatmap(M, cmap=sns.color_palette(["#F7FAFC",teal],as_cmap=True), cbar=False,
            linewidths=1,linecolor="white",square=False,ax=ax)
ax.set(xlabel="Pathway neighborhood",ylabel="Candidate gene")
ax.tick_params(axis="x",rotation=0); ax.tick_params(axis="y",rotation=0)
fig.tight_layout(); fig.savefig(OUT/"reactome-coverage.png",dpi=220,bbox_inches="tight"); plt.show()
Figure 1: Reactome-guided functional coverage of the 14 genes. Filled cells denote a curated direct pathway neighborhood or, for the final column, limited/absent direct mapping; assignments to biological modules are conservative.

A network with three biological bridges

The central insight is not a single enriched pathway. It is a set of bridges between otherwise distinct programs, shown in Figure 2:

Show reproducible Python code
fig, ax = plt.subplots(figsize=(12,8)); ax.set(xlim=(-6,6),ylim=(-4.5,4.5)); ax.axis("off")
mod_pos={"Immune regulation":(-3.7,2.7),"Inflammasomes":(0,3.2),"Barrier / adhesion":(3.7,2.7),
         "Trophic signaling":(-3.7,-2.5),"Senescence":(0,-3.1),"Under-annotated":(3.7,-2.5)}
gene_groups={"Immune regulation":["IL10","CD86","SIGLEC5"],"Inflammasomes":["NLRP3","NLRC4"],
 "Barrier / adhesion":["CDH1","CLMP"],"Trophic signaling":["GDNF"],"Senescence":["CDKN2A"],
 "Under-annotated":["FAM217B","KIAA1614","RIBC2","FOXE1","SYNE1"]}
gene_pos={}
for mod,(mx,my) in mod_pos.items():
    ax.add_patch(FancyBboxPatch((mx-1.3,my-.42),2.6,.84,boxstyle="round,pad=.08",fc=navy,ec="none"))
    ax.text(mx,my,mod,ha="center",va="center",color="white",weight="bold")
    gs=gene_groups[mod]
    span = 2.0 if mod=="Under-annotated" else 1.0
    offsets=np.linspace(-span,span,len(gs)) if len(gs)>1 else [0]
    for off,g in zip(offsets,gs):
        gx=mx+off; gy=my-1.15 if my>0 else my+1.15; gene_pos[g]=(gx,gy)
        col=gray if mod=="Under-annotated" else teal
        width = .92 if mod=="Under-annotated" else 1.1
        ax.add_patch(FancyBboxPatch((gx-width/2,gy-.25),width,.5,boxstyle="round,pad=.05",fc=col,ec="white"))
        ax.text(gx,gy,g,ha="center",va="center",color="white",weight="bold",fontsize=8 if mod=="Under-annotated" else 9)
        ax.plot([mx,gx],[my-.45 if my>0 else my+.45,gy+.27 if my>0 else gy-.27],color=col,lw=1.8)
bridges=[("Immune regulation","Inflammasomes","immune restraint / activation"),
         ("Inflammasomes","Barrier / adhesion","pyroptosis · permeability"),
         ("Barrier / adhesion","Senescence","injury · repair · selection"),
         ("Senescence","Under-annotated","methylation markers"),
         ("Trophic signaling","Barrier / adhesion","survival · tissue repair")]
for a,b,label in bridges:
    x1,y1=mod_pos[a]; x2,y2=mod_pos[b]
    ax.add_patch(FancyArrowPatch((x1,y1),(x2,y2),arrowstyle="-|>",mutation_scale=14,
                                  linestyle="--",color=coral,lw=1.8,connectionstyle="arc3,rad=.08",shrinkA=55,shrinkB=55))
    ax.text((x1+x2)/2,(y1+y2)/2+.18,label,ha="center",fontsize=8,color=coral,
            bbox=dict(fc="white",ec="none",alpha=.8,pad=1))
ax.text(0,4.15,"Curated neighborhoods connected by disease-level hypotheses",ha="center",weight="bold",fontsize=14,color=navy)
fig.tight_layout(); fig.savefig(OUT/"reactome-network.png",dpi=220,bbox_inches="tight"); plt.show()
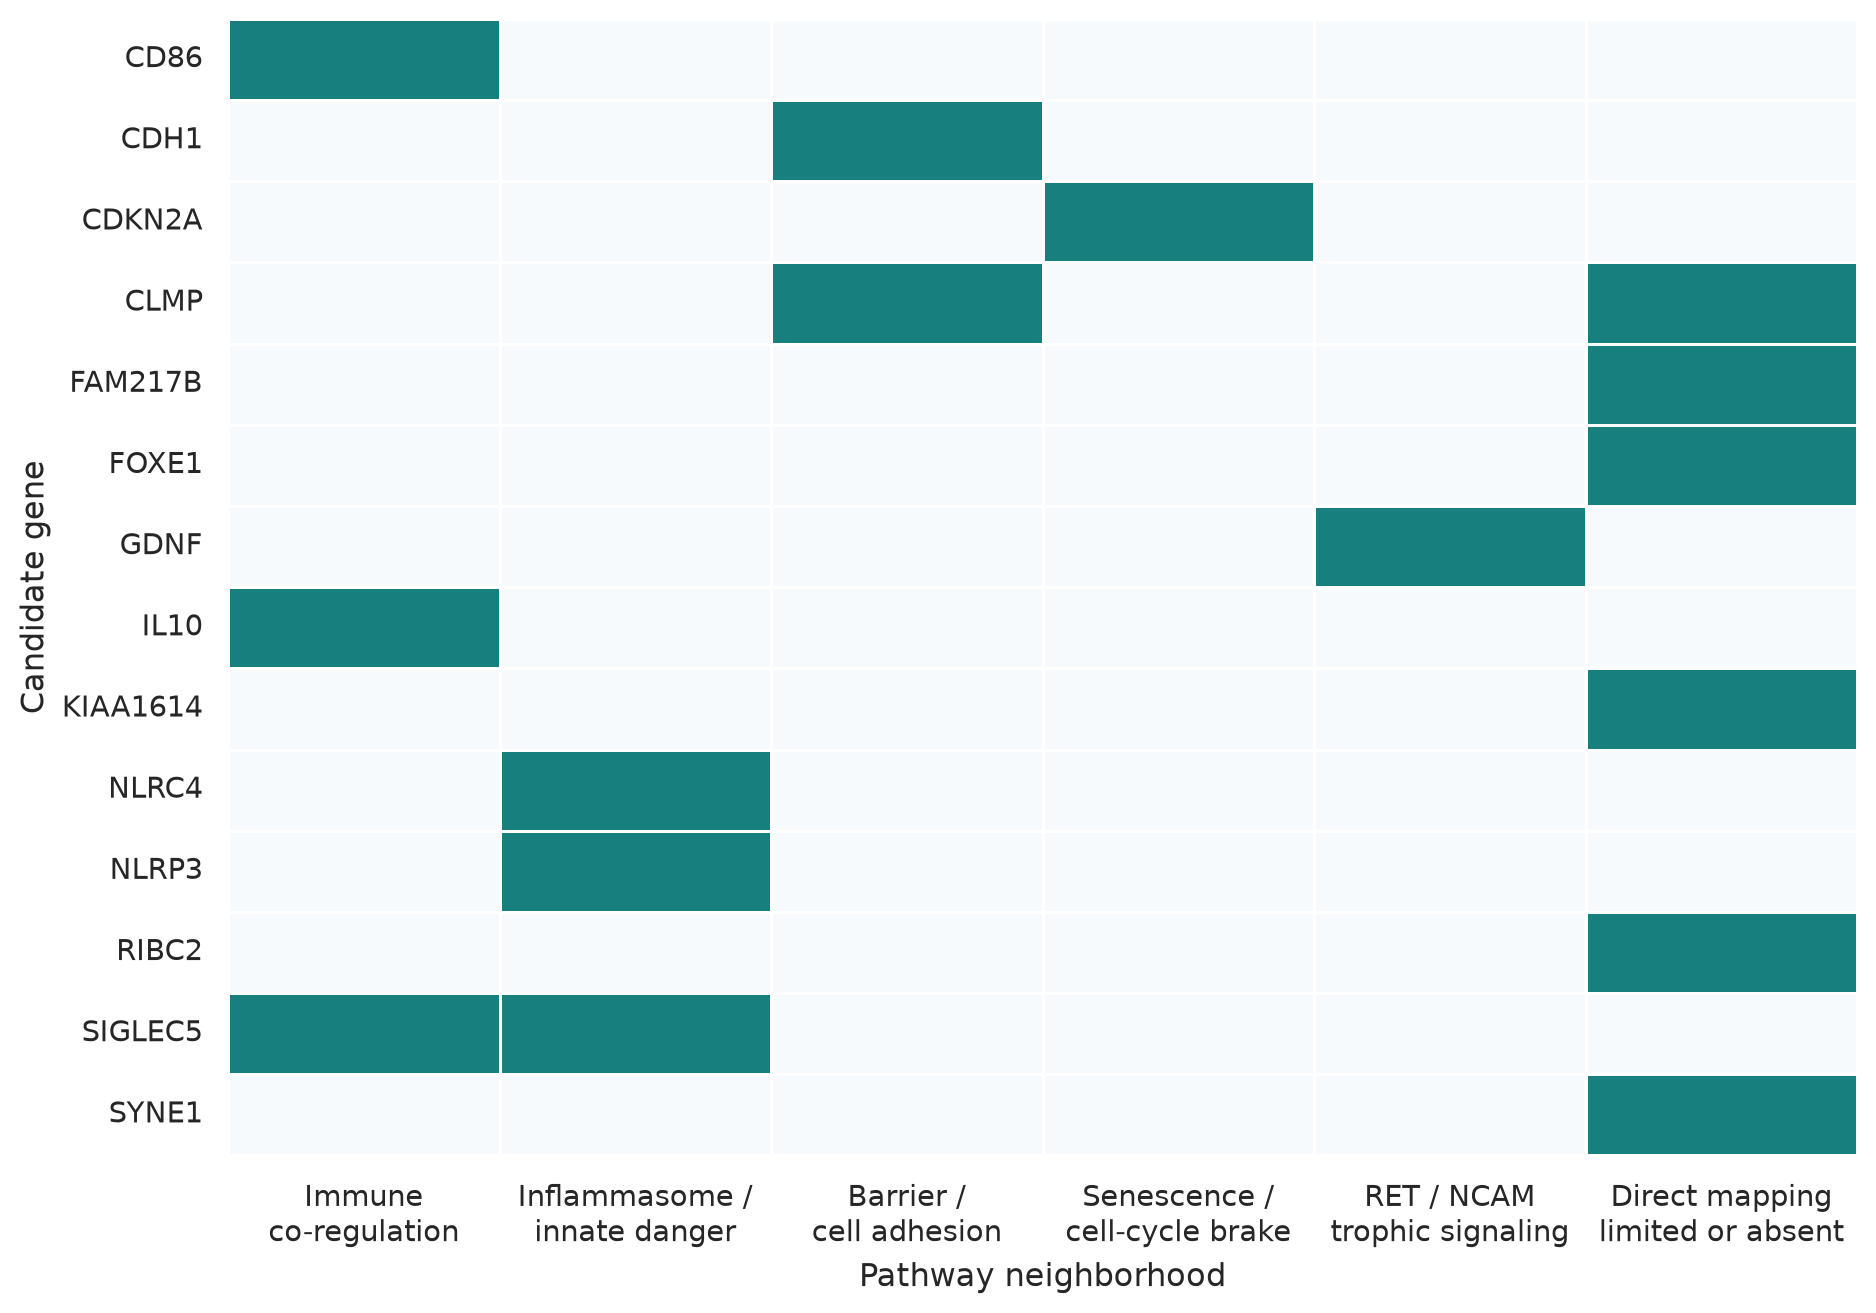
Figure 2: Reactome-guided gene-to-pathway network. Solid links are direct curated pathway memberships; dashed links are disease-level bridges proposed for colitis-to-cancer interpretation, not direct molecular reactions.

What is likely to be visible at each disease stage?

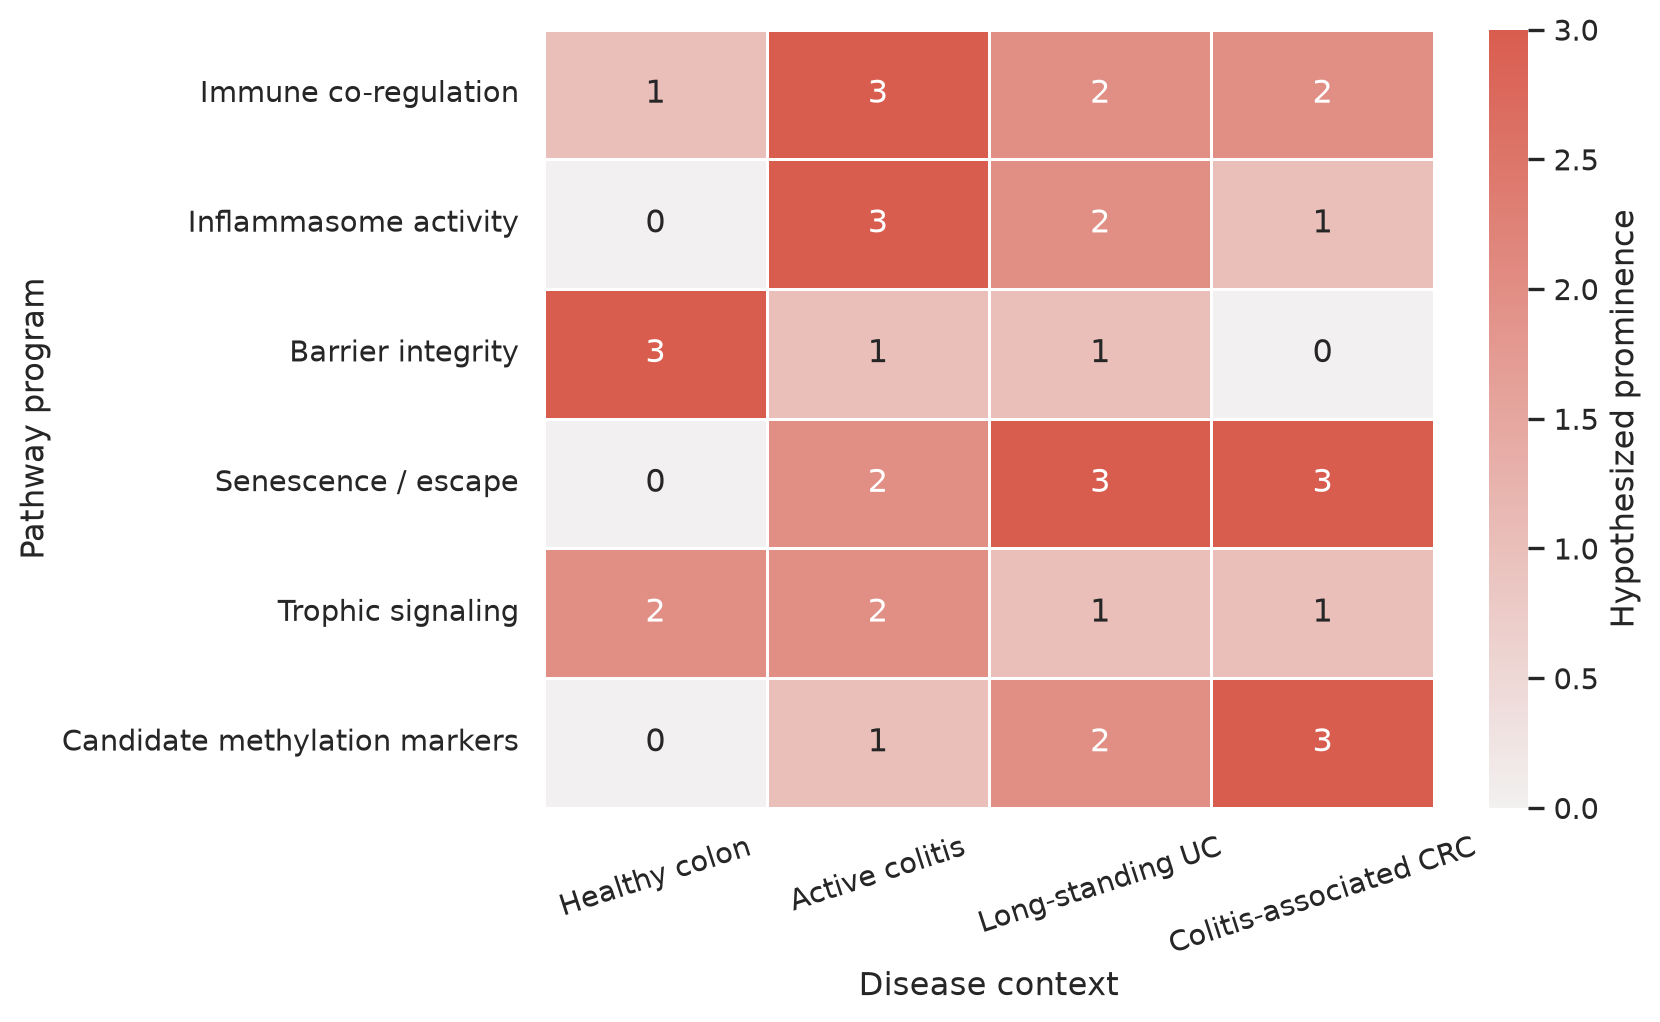
The pathway signal expected in a biopsy depends on both regulation and cell composition. Active colitis should most strongly expose innate sensing, leukocyte co-regulation, epithelial junction disruption, and compensatory IL-10. Long-standing colitis can add senescence and methylation-field signals. Established cancer may retain inflammatory circuitry while making cell-cycle escape and epithelial plasticity more prominent. Figure 3 is a qualitative expectation map, not a measured heatmap.

Show reproducible Python code
stage = pd.DataFrame({
 "Healthy colon":[1,0,3,0,2,0],
 "Active colitis":[3,3,1,2,2,1],
 "Long-standing UC":[2,2,1,3,1,2],
 "Colitis-associated CRC":[2,1,0,3,1,3]}, index=["Immune co-regulation","Inflammasome activity","Barrier integrity","Senescence / escape","Trophic signaling","Candidate methylation markers"])
fig, ax = plt.subplots(figsize=(9,5.5))
sns.heatmap(stage,cmap=sns.light_palette(coral,as_cmap=True),vmin=0,vmax=3,annot=True,fmt="d",linewidths=1,linecolor="white",cbar_kws={"label":"Hypothesized prominence"},ax=ax)
ax.set(xlabel="Disease context",ylabel="Pathway program")
ax.tick_params(axis="x",rotation=18); ax.tick_params(axis="y",rotation=0)
fig.tight_layout(); fig.savefig(OUT/"reactome-stage-map.png",dpi=220,bbox_inches="tight"); plt.show()
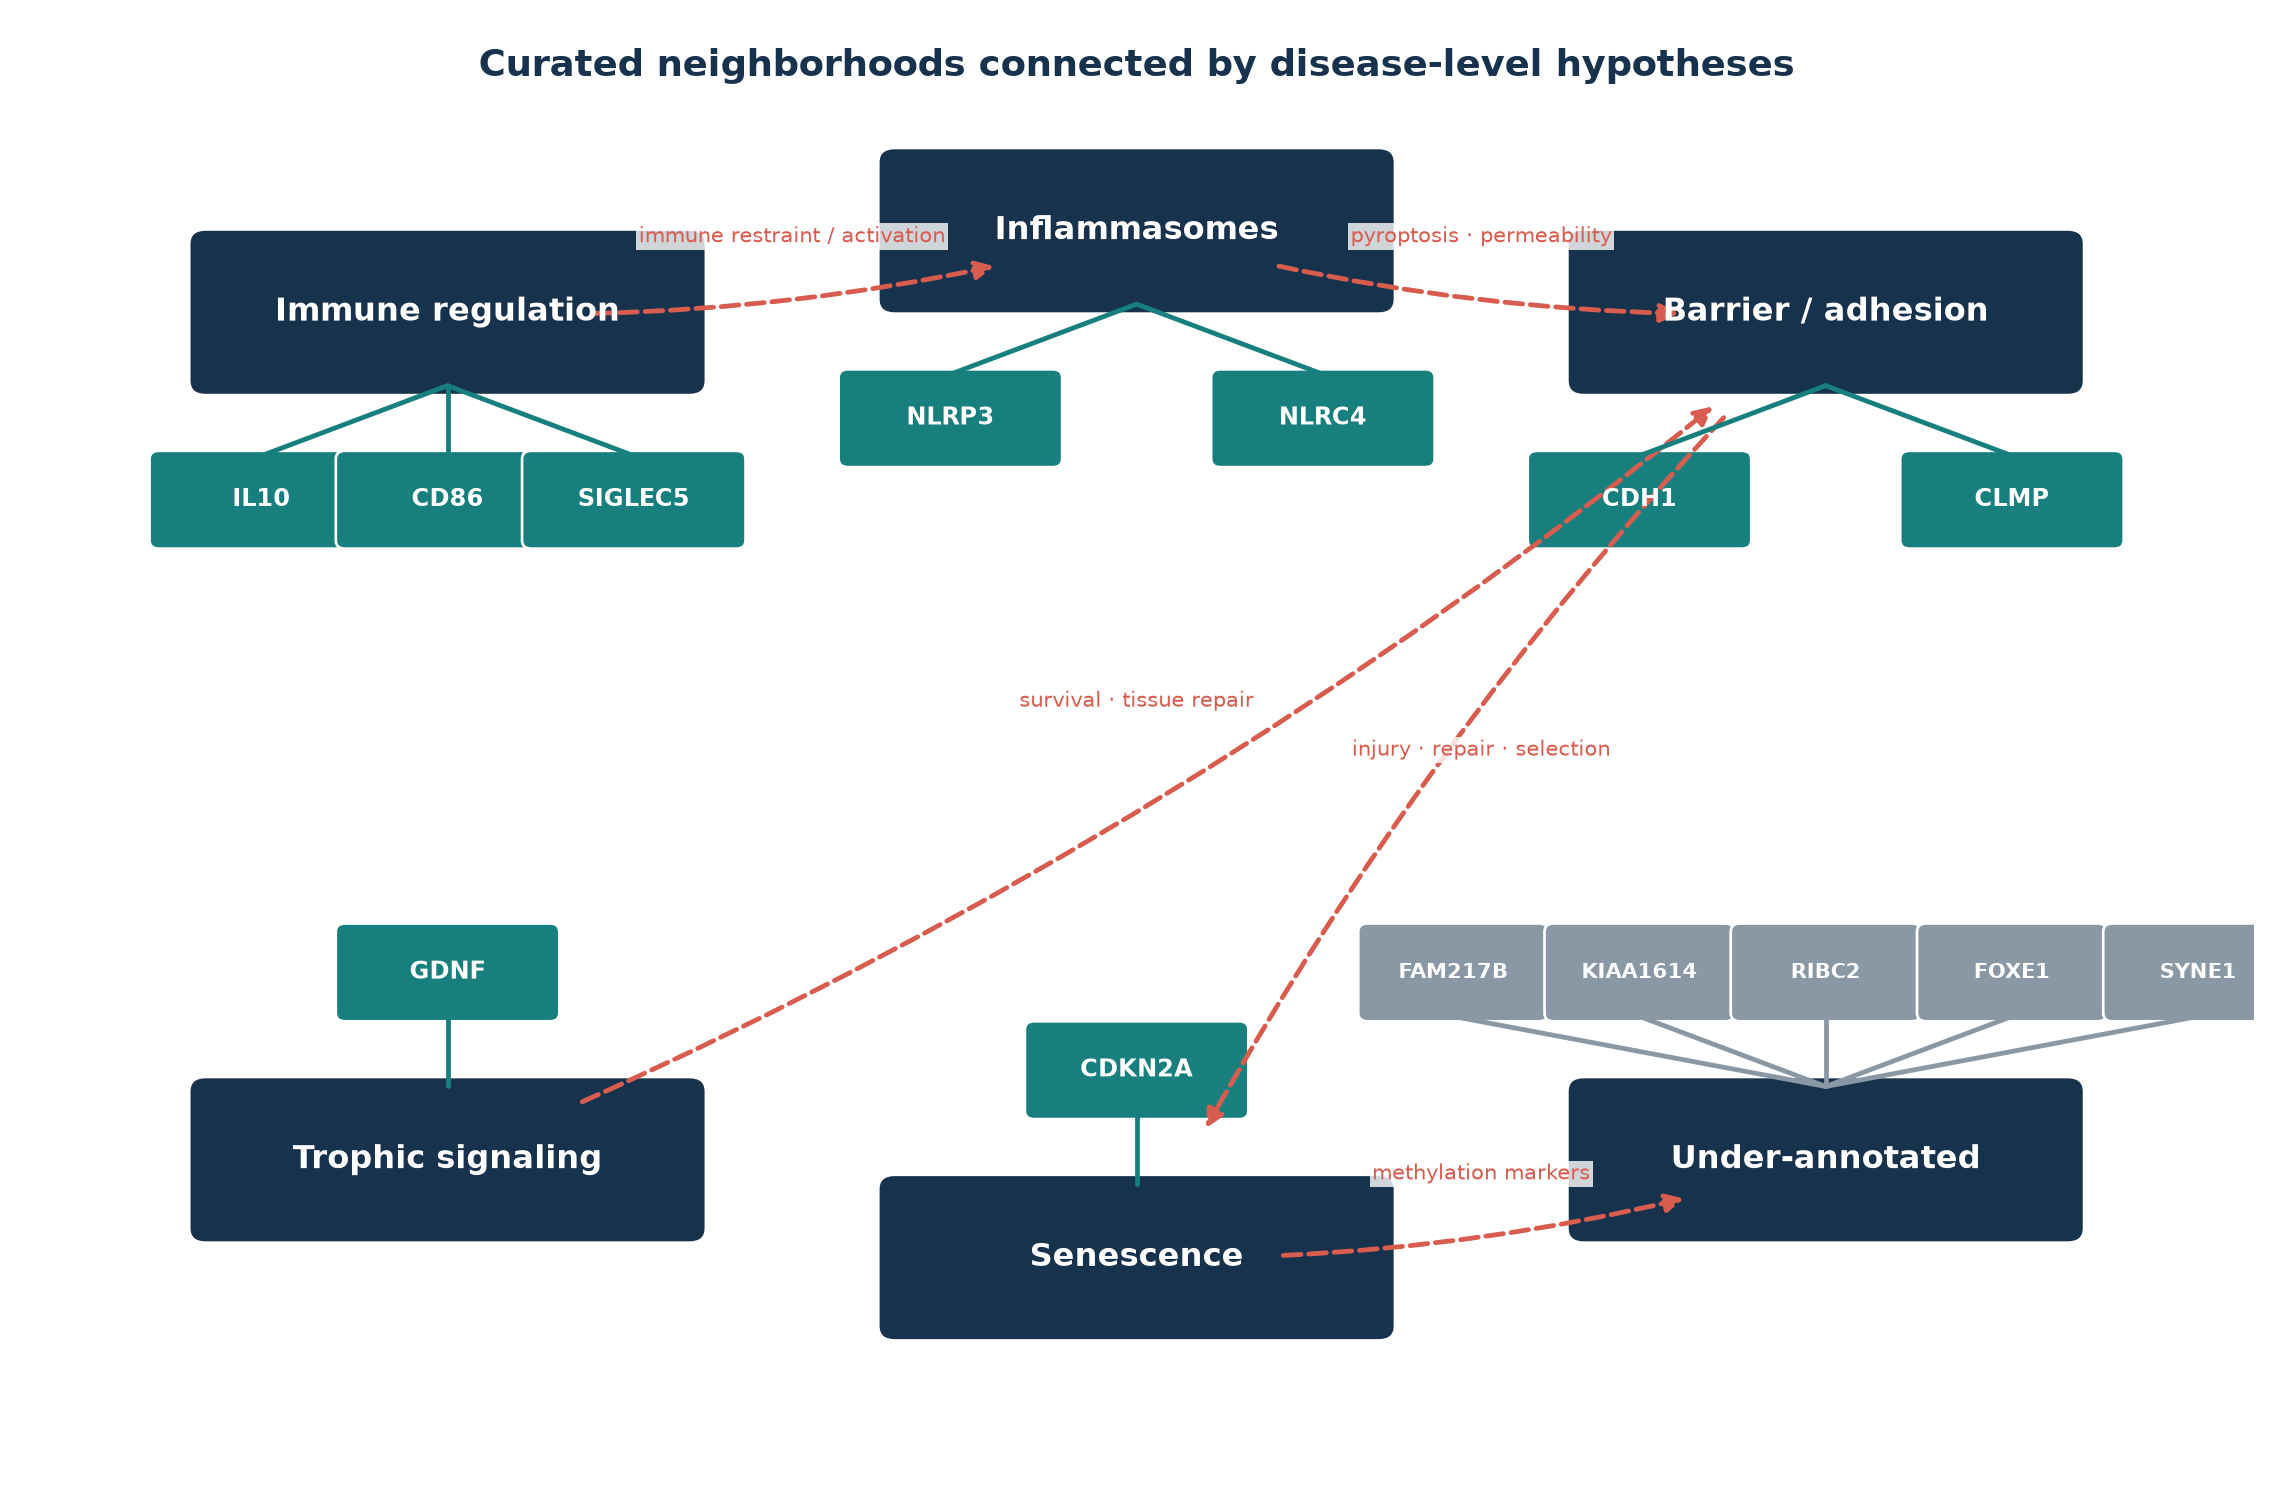
Figure 3: Qualitative hypotheses for pathway visibility across disease states. Scores encode expected relative prominence (0–3), not observed expression or clinical effect size.

Gene-by-gene Reactome reading

Gene Direct Reactome neighborhood from the query Colitis/CRC interpretation
CD86 IL-10 signaling; CD28 Vav1 and PI3K/AKT; CTLA-4 co-inhibition APC abundance and immune context; not a unidirectional activation marker
CDH1 CDH1 transcription/translation; type-I cadherins; adherens junctions Barrier architecture, epithelial plasticity, and methylation-associated silencing
CDKN2A Oncogene- and oxidative-stress-induced senescence Stress arrest in colitis; loss can permit neoplastic escape
CLMP No direct mapping in this query Strong developmental intestinal genetics, uncertain adult UC pathway (Rathjen and Jüttner, 2023)
FAM217B No direct mapping UC methylation candidate; mechanism unknown (Kang, Bae, Han, Kim, Kim, and Yi, 2016)
FOXE1 No direct mapping Neoplasia-associated methylation marker; colon driver role unproven (Papadia, Louwagie, Del Rio, Grooteclaes, Coruzzi, Montana, Novelli, Bordi, de’ Angelis, Bassett, Bigley, Warren, Atkin, and Forbes, 2014)
GDNF RET signaling; NCAM1 interactions and neurite outgrowth Trophic stromal/neural signaling; inflammation-associated methylation (Saito, Kato, Hiraoka, Horii, Suzuki, Higashi, Kaji, Kondo, and Yamamoto, 2011)
IL10 IL-10 production/signaling neighborhoods Compensatory immune brake; ligand abundance does not prove response (Glocker, Kotlarz, Boztug, and others, 2009)
KIAA1614 No direct mapping UC promoter-methylation candidate with predicted, not established, polarity biology
NLRC4 IPAF/NLRC4 inflammasome Bacterial invasion sensing after barrier breach
NLRP3 NLRP3 inflammasome DAMP and organelle-stress sensing; activation requires more than RNA or methylation
RIBC2 No direct mapping Cilia biology in Xenopus; colon relevance unresolved (Chung, Kwon, Tu, Brooks, Gupta, Meyer, Baker, Marcotte, and Wallingford, 2014)
SIGLEC5 Neutrophil degranulation; immunoregulatory interactions Myeloid abundance and inhibitory/activating paired-Siglec balance
SYNE1 Meiotic synapsis in this query The colon signal is more defensible as a methylation biomarker than this pathway mapping

The most useful experimental panel

The graph suggests measuring pathway outputs rather than adding more isolated genes. In paired tissue and plasma, a compact follow-up panel could combine:

  1. epithelial fraction, membrane E-cadherin, and permeability;
  2. NLRP3/NLRC4 complexes, cleaved caspase-1, gasdermin D, IL-1β, and IL-18;
  3. CD86-positive APC abundance, IL-10 protein, and IL-10-induced phospho-STAT3;
  4. p16INK4a/p14ARF promoter-specific methylation, RNA, protein, and RB/p53 state;
  5. exact CpGs for FAM217B, KIAA1614, RIBC2, FOXE1, and SYNE1, validated in an external cohort.

That design keeps three questions separate: Which cells are present? Which pathways are active? Which methylation changes add predictive information? Reactome is strongest for the second question. It cannot, by itself, convert an under-characterized methylation marker into a mechanism.

Back to top

References

Marija Milacic, Deidre Beavers, Patrick Conley, and others. (2024). The reactome pathway knowledgebase 2024. Nucleic Acids Research. https://doi.org/10.1093/nar/gkad1025.
Keunsoo Kang, Jin-Han Bae, Kyudong Han, Eun Soo Kim, Tae-Oh Kim, and Joo Mi Yi. (2016). A genome-wide methylation approach identifies a new hypermethylated gene panel in ulcerative colitis. International Journal of Molecular Sciences. https://doi.org/10.3390/ijms17081291.
Cinzia Papadia, Joost Louwagie, Paolo Del Rio, Madeleine Grooteclaes, Alessandro Coruzzi, Chiara Montana, Marco Novelli, Cesare Bordi, Gian Luigi de’ Angelis, Paul Bassett, Joseph Bigley, Bryan Warren, Wendy Atkin, and Alastair Forbes. (2014). FOXE1 and SYNE1 genes hypermethylation panel as promising biomarker in colitis-associated colorectal neoplasia. Inflammatory Bowel Diseases. https://doi.org/10.1097/01.MIB.0000435443.07237.ed.
Shunsuke Saito, Jun Kato, Sakiko Hiraoka, Joichiro Horii, Hideyuki Suzuki, Reiji Higashi, Eisuke Kaji, Yoshitaka Kondo, and Kazuhide Yamamoto. (2011). DNA methylation of colon mucosa in ulcerative colitis patients: Correlation with inflammatory status. Inflammatory Bowel Diseases. https://doi.org/10.1002/ibd.21573.
J. M. Wheeler, H. C. Kim, J. A. Efstathiou, M. Ilyas, N. J. Mortensen, and W. F. Bodmer. (2001). Hypermethylation of the promoter region of the e-cadherin gene (CDH1) in sporadic and ulcerative colitis associated colorectal cancer. Gut. https://doi.org/10.1136/gut.48.3.367.
C. J. Hsieh, B. Klump, K. Holzmann, F. Borchard, M. Gregor, and R. Porschen. (1998). Hypermethylation of the p16INK4a promoter in colectomy specimens of patients with long-standing and extensive ulcerative colitis. Cancer Research.
Fritz G. Rathjen and René Jüttner. (2023). The IgSF cell adhesion protein CLMP and congenital short bowel syndrome. International Journal of Molecular Sciences. https://doi.org/10.3390/ijms24065719.
Erik-Oliver Glocker, Daniel Kotlarz, Kaan Boztug, and others. (2009). Inflammatory bowel disease and mutations affecting the interleukin-10 receptor. New England Journal of Medicine. https://doi.org/10.1056/NEJMoa0907206.
Mei-I Chung, Taekyoung Kwon, Fang Tu, Elizabeth R. Brooks, Richa Gupta, Matthew Meyer, Jason C. Baker, Edward M. Marcotte, and John B. Wallingford. (2014). Coordinated genomic control of ciliogenesis and cell movement by RFX2. eLife. https://doi.org/10.7554/eLife.01439.