flowchart LR
  D["FDR-controlled<br/>DMRs"] --> A["Map regions to genes<br/>with explicit rules"]
  A --> L["Candidate gene list"]
  U["Genes linked to all<br/>regions actually tested"] --> E["KEGG enrichment test"]
  L --> E
  E --> R["Pathway overlap<br/>effect + adjusted p-value"]
  R --> I["Biological hypothesis<br/>for validation"]
What is KEGG?
pathways
bioinformatics
methylation
statistics
A short guide to KEGG pathways, enrichment analysis, and responsible interpretation of methylation-associated gene lists
A map, not a measurement
The Kyoto Encyclopedia of Genes and Genomes (KEGG) organizes genes, proteins, metabolites, diseases, and drugs into manually drawn pathway maps. It helps researchers ask whether a result list contains more members of a known biological system than expected by chance. KEGG does not measure pathway activity and does not prove that a pathway causes disease.
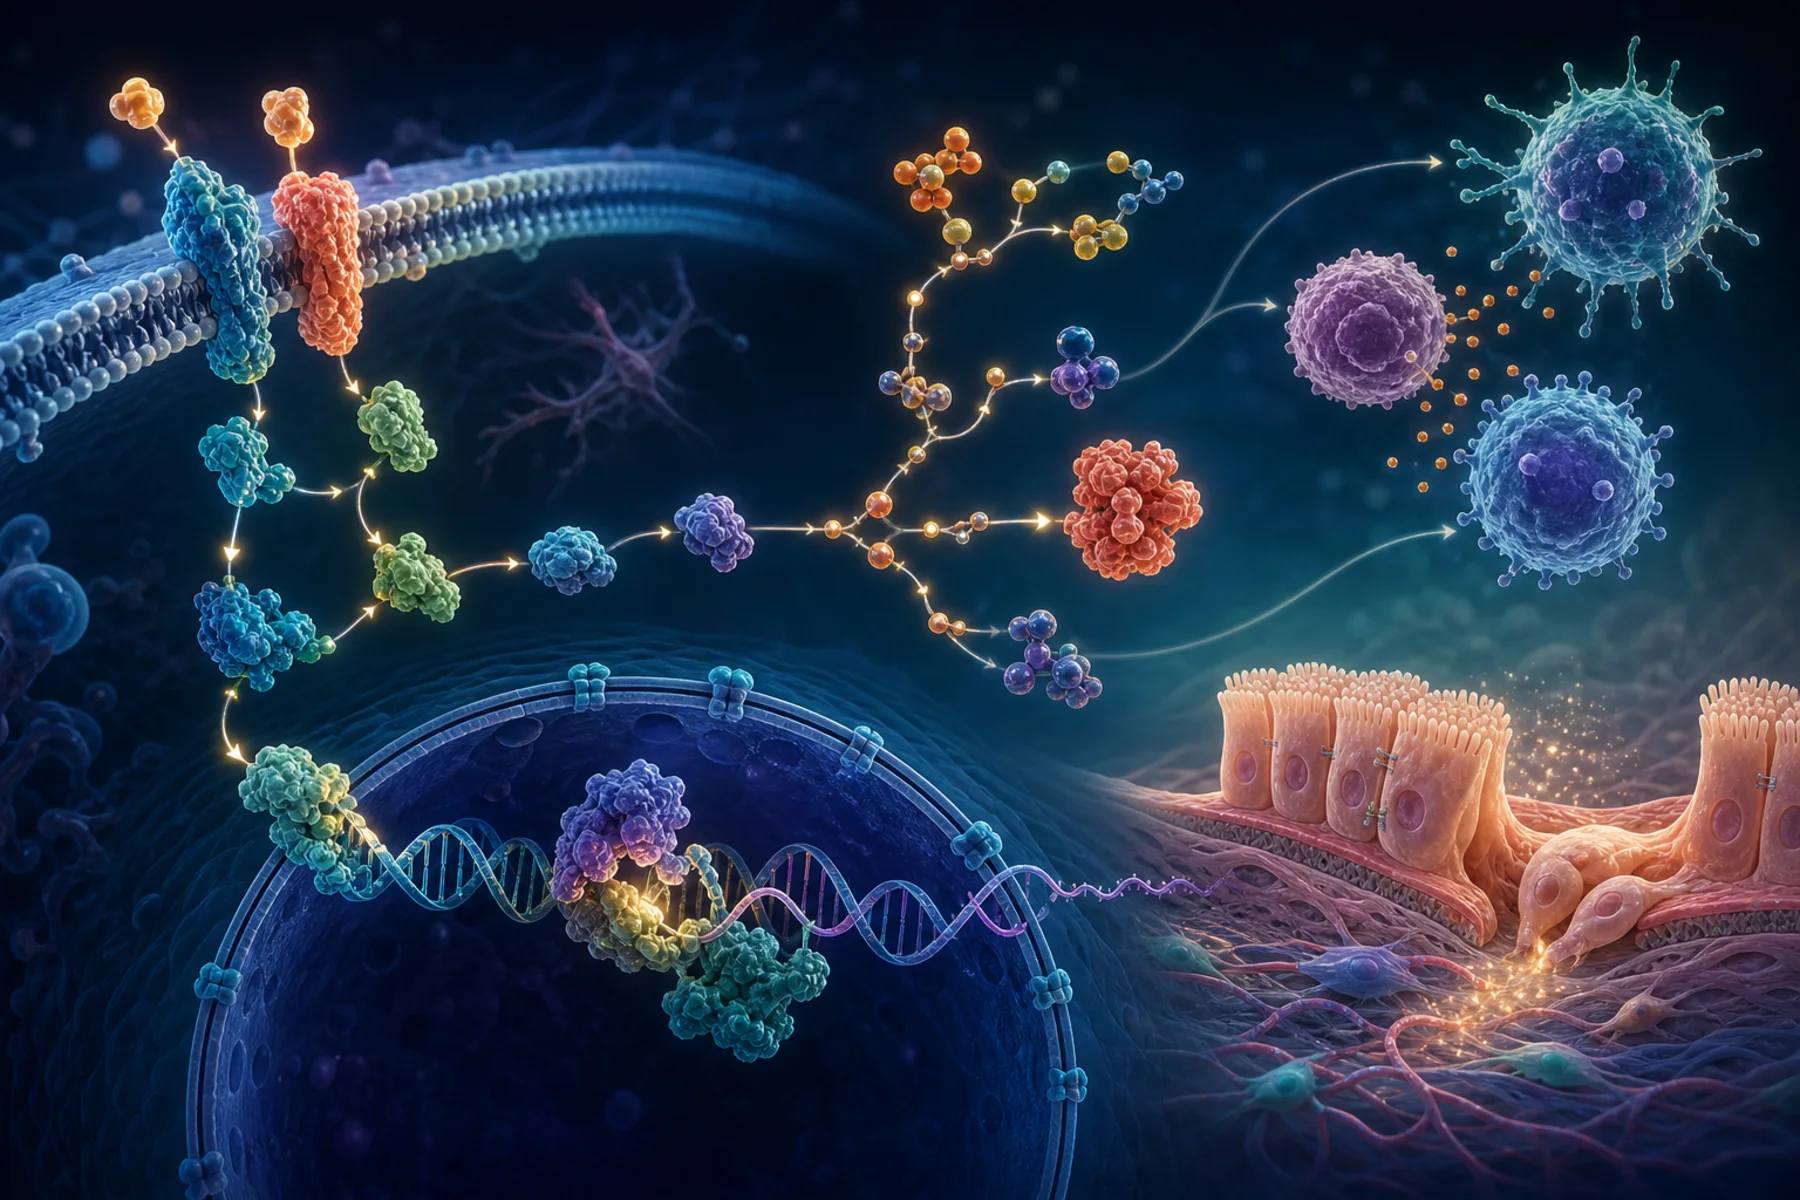
What a KEGG pathway contains
A KEGG PATHWAY map is a network of molecular interactions, reactions, and processes. Broad collections include metabolism, genetic and environmental information processing, cellular processes, organismal systems, human diseases, and drug development. Organism-specific identifiers connect human genes to these maps.
How enrichment works
Over-representation analysis compares two proportions: the fraction of candidate genes belonging to a pathway and the fraction in a relevant background universe. A hypergeometric or Fisher exact test is common, followed by false-discovery-rate correction across pathways. Ranked-list methods such as gene-set enrichment analysis can instead test whether a pathway’s genes accumulate toward one end of an ordered statistic.
The background matters enormously. For this study it should represent genes that could have been discovered after coverage, filtering, and region-to-gene mapping—not every human gene. Using the whole genome can make enrichment appear stronger simply because many genes were never testable.
How KEGG helps this study
After coverage-aware DML/DMR analysis, KEGG can organize candidate genes into interpretable systems potentially related to:
- inflammatory and immune signaling;
- epithelial integrity and cell adhesion;
- apoptosis, cell cycle, and DNA repair;
- host–microbe interactions; and
- colorectal tumor biology.
These labels are prompts for biological follow-up. A methylated promoter near a pathway gene does not automatically mean the gene is less expressed; the effect depends on genomic context, cell mixture, direction, and functional evidence.
What should be reported
| Item | Why readers need it |
|---|---|
| KEGG release or access date | Pathway membership changes over time |
| Genome build and identifier conversion | Prevents silent coordinate/gene mismatches |
| CpG/DMR-to-gene rule | One region may map to several genes—or none |
| Tested-feature background | Defines the actual null comparison |
| Overlap genes and counts | Shows what produced the pathway result |
| Effect measure and adjusted p-value | Separates magnitude from multiplicity |
| Direction of methylation change | Avoids mixing hyper- and hypomethylated biology |
In R, clusterProfiler provides transparent KEGG enrichment workflows. Reproducibility still depends on saving identifiers, inputs, parameters, software version, and database date. Users should also check KEGG’s database and licensing information for the intended access and reuse.
ImportantBottom line
KEGG converts a statistically supported gene list into a structured biological question. It is strongest when the gene-mapping rule, tested background, overlap, and uncertainty are visible—and weakest when a colorful pathway name is treated as proof of mechanism.
Compare Reactome → · See the statistical workflow → · Read the software guide →