set.seed(2026)
methylation <- data.frame(
  sample_id = sprintf("synthetic_%02d", 1:20),
  group = rep(c("comparison", "colitis"), each = 10),
  beta_value = c(rbeta(10, 4, 6), rbeta(10, 5, 5))
)Example: methylation summary workflow
R
quality-control
template
A safe synthetic-data example for a reproducible Quarto analysis.
Purpose
This template demonstrates the expected notebook structure using synthetic data. Replace it with a platform-appropriate workflow after agreeing on the analysis plan.
Quality checks
stopifnot(
  !anyDuplicated(methylation$sample_id),
  all(methylation$beta_value >= 0 & methylation$beta_value <= 1)
)

aggregate(beta_value ~ group, methylation, function(x) {
  c(n = length(x), mean = mean(x), sd = sd(x))
})
group beta_value.n beta_value.mean beta_value.sd
1 colitis 10.00000000 0.50690153 0.12041612
2 comparison 10.00000000 0.33993347 0.08904381Exploratory visualization
boxplot(
  beta_value ~ group,
  data = methylation,
  col = c("#9ecae1", "#41ae76"),
  ylab = "Beta value",
  xlab = "",
  ylim = c(0, 1)
)
stripchart(beta_value ~ group, data = methylation,
           vertical = TRUE, method = "jitter", add = TRUE, pch = 16)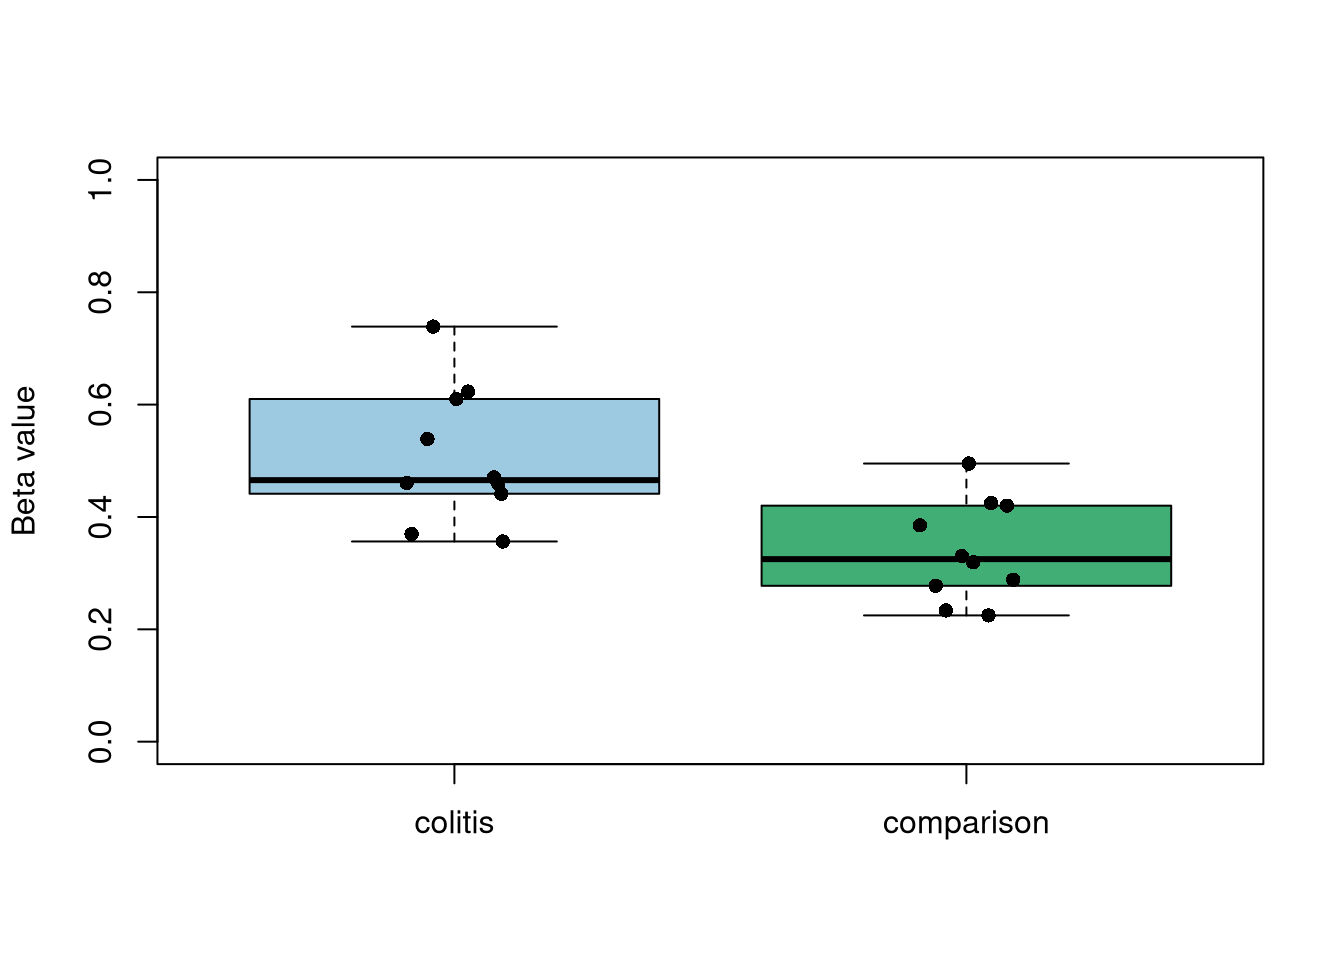
Interpretation
These values are simulated and carry no scientific or clinical meaning. A real workflow must pre-specify normalization, probe filtering, batch handling, model covariates, and multiple-testing correction.