flowchart LR
P[One participant] --> R1[Technical replicate 1]
P --> R2[Technical replicate 2]
P --> R3[Technical replicate 3]
R1 --> QC{Replicate QC}
R2 --> QC
R3 --> QC
QC --> C[One consensus participant profile]
C --> G{UC, CRC, or healthy group}
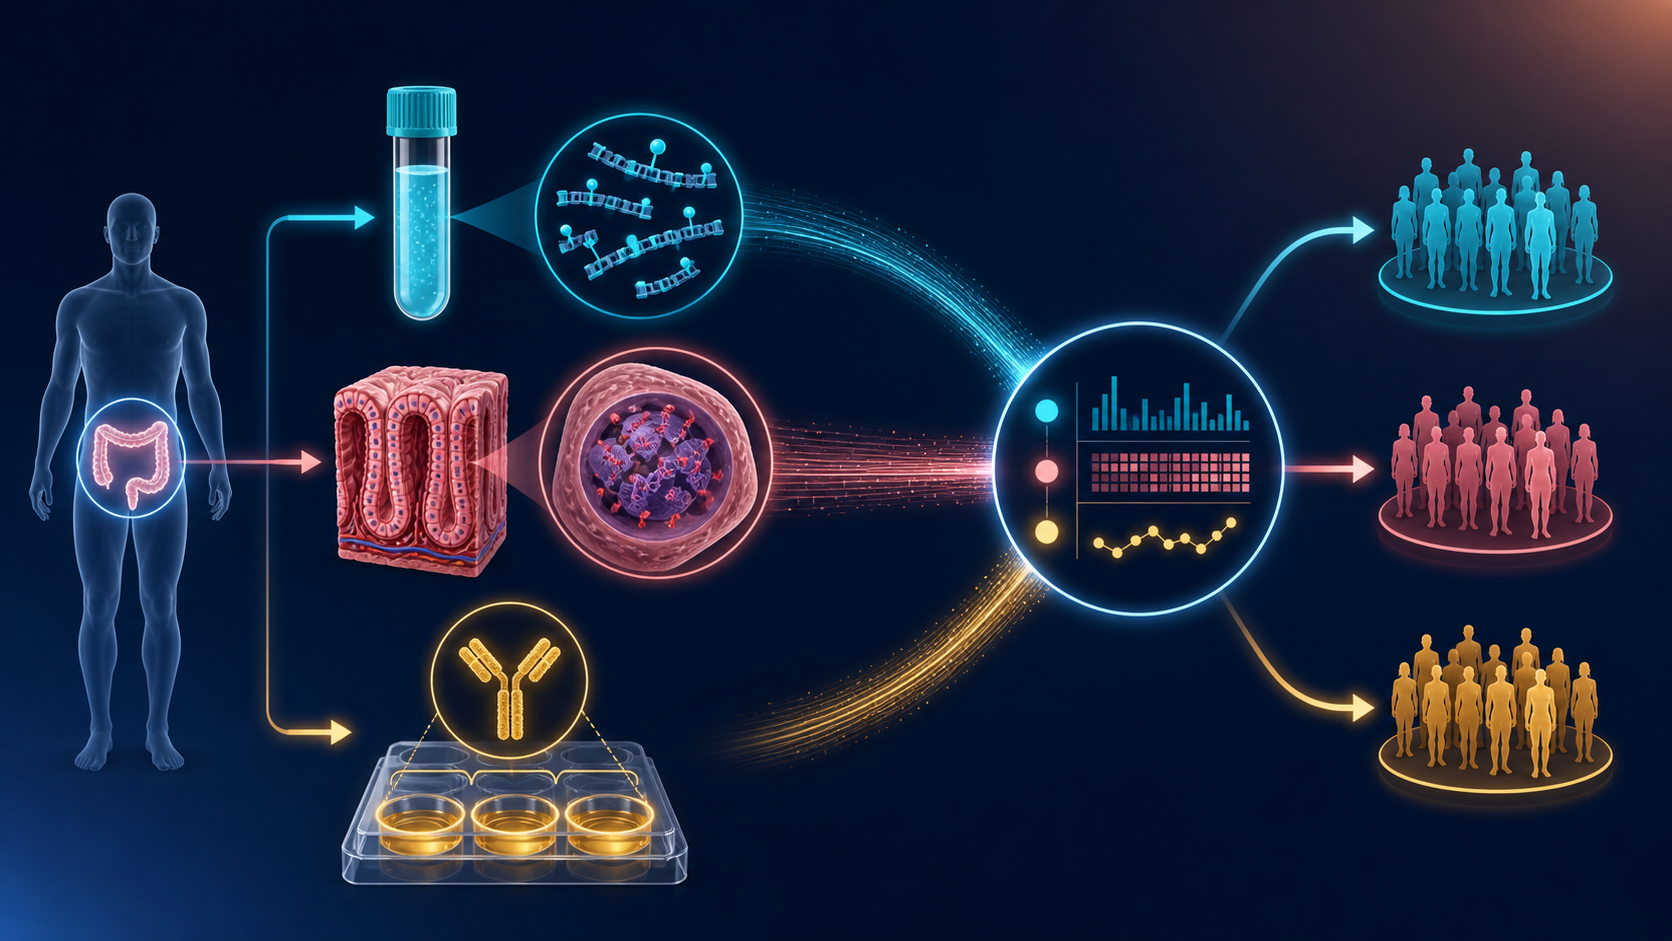
Three data sources, one patient-level picture
study design
multi-omics
cfDNA
methylation
sIgA
What plasma cfDNA, colonic tissue DNA, and serum sIgA each contribute—and what their processed data may look like
Three views of the same participant
Plasma cfDNA asks what reaches the bloodstream. Colonic tissue DNA asks what is happening at the disease site. Serum sIgA adds an immune-barrier measurement. None is a complete answer; together they can reveal whether circulating, local, and immune signals tell a coherent story.
The study groups we hope to distinguish
The planned cohort contains three clinical groups:
| Group | Planned participants | What it contributes to the comparison |
|---|---|---|
| High-risk ulcerative colitis | 8 | The inflammatory disease state of primary interest |
| Colorectal cancer | 5 | A neoplastic comparator |
| Healthy comparators | 5 | A reference distribution |
The first goal is to estimate how the distributions of each data stream differ across these groups. With 18 participants, the study can explore a candidate disease-state fingerprint; it cannot yet establish a clinical classifier or prove progression from UC to cancer.
What comes out of each source?
1. Plasma cfDNA sequencing: the accessible mixture
EM-seq reads from plasma can be processed into CpG-level methylated and total read counts. Because the original cfDNA molecules are short, the same aligned data can also support fragment-length, fragment-end, and regional-coverage summaries.
participant_id  specimen  tech_rep  chr   pos       methylated  coverage  beta   qc
P001            plasma    1         chr1  2938265   6           18        0.333  PASS
P001            plasma    2         chr1  2938265   7           20        0.350  PASS
P001            plasma    3         chr1  2938265   5           17        0.294  PASS
Useful processed products include:
- CpG count matrices: methylated reads (
M) and informative coverage (N); - DMR-level methylation summaries;
- fragment size and end-motif features;
- tissue-of-origin or leukocyte-background estimates; and
- library QC such as mapped reads, duplication, conversion controls, and usable CpG coverage.
Value: a blood draw is repeatable and translationally attractive. Cost: colon-derived molecules may be a tiny fraction of a plasma mixture dominated by blood-cell DNA.
2. Colonic tissue DNA: the local reference
Tissue EM-seq produces the same basic CpG count structure, usually with a stronger local signal. Genomic coordinates let plasma and tissue be compared at the same CpGs and regions.
participant_id  specimen  tech_rep  chr   pos       methylated  coverage  beta   region_id
P001            tissue    1         chr1  2938265   41          52        0.788  DMR_0042
P001            tissue    2         chr1  2938265   39          50        0.780  DMR_0042
P001            tissue    3         chr1  2938265   43          54        0.796  DMR_0042
Useful processed products include:
- CpG and DMR methylation effects for UC, CRC, and healthy contrasts;
- promoter, enhancer, gene-body, and CpG-island annotations;
- pathway summaries; and
- participant-matched tissue–plasma concordance measures.
Value: tissue anchors a methylation change to the colon. Cost: a biopsy samples one heterogeneous location and is not convenient for frequent monitoring.
3. Serum sIgA: the immune-barrier axis
sIgA is measured by ELISA, not sequencing. Optical density is blank-corrected and mapped through a standard curve, with dilution correction, to produce an estimated concentration.
participant_id  assay  tech_rep  plate  well  dilution  od450  concentration_ug_ml  qc
P001            sIgA   1         A01    B03   1:100     0.842  0.74                 PASS
P001            sIgA   2         A01    B04   1:100     0.816  0.71                 PASS
P001            sIgA   3         A01    B05   1:100     0.831  0.73                 PASS
Useful processed products include:
- replicate optical densities and flags;
- blank-corrected, dilution-adjusted concentration;
- replicate coefficient of variation;
- plate, standard-curve, LLOQ, and ULOQ metadata; and
- one quality-controlled participant-level sIgA estimate.
Value: sIgA adds a lower-dimensional immune measurement that may explain or complement methylation patterns. Cost: serum sIgA is not a direct count of mucosal IgA or IgA-coated gut microbes.
Three technical replicates are quality control—not three patients
The laboratory processes three technical replicates from each participant. Those repeats help expose pipetting variation, library preparation instability, plate effects, low coverage, or a failed well. They increase confidence in the measurement, but they do not increase the biological sample size from 18 to 54.
A defensible workflow retains every replicate in the audit trail, applies pre-specified failure rules, quantifies agreement, and creates a consensus at the appropriate level. For ELISA this may be a mean concentration after QC. For sequencing, blindly averaging beta values is less attractive than combining valid read counts or modeling replicate/library effects while preserving coverage.
The integrated table
After replicate QC, the three streams meet in a participant-level analysis table:
participant_id  group  plasma_DMR_0042  tissue_DMR_0042  siga_ug_ml  inflammation  batch
P001            UC     0.34             0.79             0.73        5.2           B1
P002            CRC    0.51             0.88             0.46        3.1           B1
P003            Healthy 0.08            0.12             0.91        0.4           B2
The real table will contain carefully selected DMR or pathway summaries—not millions of CpGs beside 18 rows. It can support four progressively harder questions:
- Does each measurement differ across UC, CRC, and healthy participants?
- Do tissue and plasma share the same methylation direction within a participant?
- Does sIgA explain additional variation beyond clinical group and inflammation?
- Does a small, pre-specified combination separate the three groups in participant-level resampling?
The fourth question is exploratory. Feature selection must happen inside each training resample, and any candidate signature must be tested in an independent cohort before being called a classifier.
ImportantWhy all three are more valuable together
Tissue supplies location, plasma supplies accessibility, and sIgA supplies immune context. Agreement strengthens a biological hypothesis; disagreement can reveal dilution, tissue heterogeneity, systemic inflammation, or technical failure rather than simply being discarded.
See the complete study design → · Compare tissue and plasma methylation → · Follow the sequencing workflow → · Review the sIgA assay →