Could a blood draw ever replace part of a colonoscopy?

Where a 14-gene methylation fingerprint, tissue–plasma validation, and serum sIgA would fit in ulcerative colitis care

clinical translation
liquid biopsy
ulcerative colitis
colorectal cancer
biomarkers
sIgA
The clinical problems an integrated epigenetic and mucosal-immune signal could address—and the ones it could not
Author

Methylation & Colitis team

Published

August 26, 2026

In 2024 the United States gained two new non-invasive options for colorectal cancer screening: a cell-free DNA blood test (Chung, Gray, Singh, and others, 2024) and a next-generation multitarget stool DNA test (Imperiale, Porter, Zella, and others, 2024). Neither is available to the patients this project studies. Both are indicated for adults at average risk, and inflammatory bowel disease—chronic ulcerative colitis included—sits in the contraindication list precisely because these tests were never clinically evaluated in that population. The people at highest risk of colitis-associated colorectal cancer are the people carved out of every approved non-invasive test.

What this post is

A structured walk through the clinical questions an integrated methylation + sIgA signal would have to answer before it could change anything in a gastroenterology clinic. It is a hypothetical care-pathway analysis, written for clinicians. Nothing here reports performance from this cohort; the study is exploratory, cross-sectional, and has 18 participants.

What happens today to a patient with 20 years of ulcerative colitis?

They enter a colonoscopic surveillance programme. Guidelines converge on periodic examination of the whole colon with high-definition endoscopy, targeted biopsy of any visible lesion, and—depending on risk factors such as primary sclerosing cholangitis, prior neoplasia, active inflammation, or a foreshortened colon—additional random biopsies (Laine, Kaltenbach, Barkun, and others, 2015; Murthy, Feuerstein, Nguyen, and Velayos, 2021). The interval is set by a risk stratification that leans on inflammation history and endoscopic appearance rather than on any molecular measurement.

The programme works, but only partly. In the longest-running surveillance cohort published, 1,375 patients with ulcerative colitis were followed for 15,234 patient-years and 72 developed colorectal cancer, an incidence of 4.7 per 1,000 patient-years; rates of advanced and interval cancer fell across four decades, yet cancers kept appearing between examinations, and 37.5% of the cancers found were accompanied by synchronous cancer or spatially separate dysplasia (Choi, Rutter, Askari, and others, 2015). Across 96,447 Danish and Swedish patients with ulcerative colitis, colorectal cancer incidence remained elevated against matched population controls (HR 1.66, 95% CI 1.57–1.76), as did cancer-specific mortality (HR 1.59, 95% CI 1.46–1.72) (Olén, Erichsen, Sachs, and others, 2020).

Why isn’t colonoscopy already the answer?

Because the thing being hunted is often invisible. Colitis-associated neoplasia arises in a field of chronically injured mucosa, is frequently flat rather than polypoid, and can be multifocal. The blunt summary from the ENDCaP-C investigators is that despite surveillance protocols, half of cases progress to cancer before neoplasia is detected (Beggs, Mehta, Deeks, and others, 2019). Chromoendoscopy improves detection—in the St Mark’s cohort it was twice as effective as white-light endoscopy at finding dysplasia (Choi, Rutter, Askari, and others, 2015)—but adoption is uneven, it lengthens the procedure, and it does not make a diffuse molecular field change visible to the eye.

There is also the part of the problem that has nothing to do with optics. Surveillance colonoscopy requires bowel preparation, sedation, a day lost, an endoscopy slot, and a pathologist. Those are real constraints anywhere and binding constraints in a health system with limited endoscopic capacity, which is directly relevant to a Colombian cohort. Any test that could tell a clinician which patients most need the next slot would be doing useful work even if it never replaced a single procedure.

Show reproducible Python code
fig, ax = plt.subplots(figsize=(14, 6.4))
ax.set(xlim=(0, 16), ylim=(0, 7.4)); ax.axis("off")
ax.set_facecolor("white")

vp_x = [0.3, 4.2, 8.1, 12.0]
VW, VY, VH = 3.2, 3.5, 3.2

# connector wedges between viewports
for i in range(3):
    x0 = vp_x[i] + VW; x1 = vp_x[i + 1]
    ax.add_patch(Polygon([(x0, VY), (x0, VY + VH), (x1, VY + VH * 0.86), (x1, VY + VH * 0.14)],
                         closed=True, fc=pale, ec=gray, lw=0.8, alpha=0.85, zorder=0))
    ax.text((x0 + x1) / 2, VY + VH / 2, "zoom", ha="center", va="center",
            color=gray, fontsize=8, style="italic", rotation=90)

for x in vp_x:
    ax.add_patch(FancyBboxPatch((x, VY), VW, VH, boxstyle="round,pad=0.04",
                                fc="white", ec=navy, lw=1.6, zorder=1))

# 1 · colon segment with an inflamed field
cx = vp_x[0] + VW / 2
ax.add_patch(FancyBboxPatch((cx - 1.25, VY + 1.0), 2.5, 1.35, boxstyle="round,pad=0.06",
                            fc="#F6E3DE", ec=coral, lw=1.6, zorder=2))
ax.add_patch(FancyBboxPatch((cx - 1.05, VY + 1.25), 2.1, 0.85, boxstyle="round,pad=0.04",
                            fc="white", ec=gray, lw=1.0, zorder=3))
for dx in (-0.62, 0.0, 0.62):
    ax.add_patch(Ellipse((cx + dx, VY + 1.67), 0.42, 0.30, fc=coral, ec="none", alpha=0.55, zorder=4))
ax.text(cx, VY + 2.72, "Long-standing pancolitis", ha="center", color=navy, weight="bold", fontsize=9.5)
ax.text(cx, VY + 0.55, "the endoscopist's view", ha="center", color=gray, fontsize=8.5, style="italic")

# 2 · mucosa and crypts
cx = vp_x[1] + VW / 2
for j, dx in enumerate((-1.05, -0.53, 0.0, 0.53, 1.05)):
    distorted = (j == 3)
    ax.add_patch(FancyBboxPatch((cx + dx - 0.16, VY + 0.85), 0.32, 1.5 if not distorted else 1.15,
                                boxstyle="round,pad=0.03",
                                fc="#DDEDEA" if not distorted else "#F6E3DE",
                                ec=teal if not distorted else coral, lw=1.4, zorder=2))
ax.add_patch(Rectangle((cx - 1.35, VY + 2.42), 2.7, 0.16, fc=gold, ec="none", alpha=0.7, zorder=2))
ax.annotate("branched, shortened crypt", xy=(cx + 0.53, VY + 2.0), xytext=(cx + 0.1, VY + 3.05),
            ha="center", color=coral, fontsize=8, weight="bold",
            arrowprops=dict(arrowstyle="-|>", color=coral, lw=1.2))
ax.text(cx, VY + 0.55, "mucosa · architecture", ha="center", color=gray, fontsize=8.5, style="italic")

# 3 · epithelial cell and nucleus
cx = vp_x[2] + VW / 2
ax.add_patch(Ellipse((cx, VY + 1.65), 2.5, 1.85, fc="#DDEDEA", ec=teal, lw=1.6, zorder=2))
ax.add_patch(Circle((cx, VY + 1.65), 0.66, fc=navy, ec="none", zorder=3))
for _ in range(9):
    a = rng.uniform(0, 2 * np.pi); r = rng.uniform(0.08, 0.48)
    ax.plot([cx + r * np.cos(a) - 0.07, cx + r * np.cos(a) + 0.07],
            [VY + 1.65 + r * np.sin(a), VY + 1.65 + r * np.sin(a) + 0.05],
            color=gold, lw=1.6, zorder=4)
ax.annotate("nucleus", xy=(cx + 0.5, VY + 2.05), xytext=(cx + 1.0, VY + 2.95),
            color=navy, fontsize=8, weight="bold",
            arrowprops=dict(arrowstyle="-|>", color=navy, lw=1.2))
ax.text(cx, VY + 0.55, "cell state · cell of origin", ha="center", color=gray, fontsize=8.5, style="italic")

# 4 · CpG island at a panel promoter
cx = vp_x[3] + VW / 2
ax.plot([cx - 1.35, cx + 1.35], [VY + 1.55, VY + 1.55], color=navy, lw=2.4, zorder=2, solid_capstyle="round")
ax.add_patch(FancyBboxPatch((cx - 1.15, VY + 1.32), 1.5, 0.46, boxstyle="round,pad=0.03",
                            fc=gold, ec="none", alpha=0.35, zorder=1))
ax.text(cx - 0.40, VY + 1.06, "CpG island", ha="center", color="#8a6a1f", fontsize=8, weight="bold")
ax.add_patch(FancyArrowPatch((cx + 0.45, VY + 1.55), (cx + 1.3, VY + 1.55), arrowstyle="-|>",
                             mutation_scale=13, color=teal, lw=2.2, zorder=3))
ax.text(cx + 0.9, VY + 1.06, "gene body", ha="center", color=teal, fontsize=8, weight="bold")
meth = [1, 1, 0, 1, 1, 1, 0, 1]
for k, m in enumerate(meth):
    px = cx - 1.10 + k * 0.21
    ax.plot([px, px], [VY + 1.55, VY + 2.02], color=navy, lw=1.1, zorder=3)
    ax.add_patch(Circle((px, VY + 2.10), 0.088, fc=coral if m else "white",
                        ec=coral if m else navy, lw=1.3, zorder=4))
ax.text(cx, VY + 2.62, "one EM-seq read, CpG by CpG", ha="center", color=navy, weight="bold", fontsize=9)
ax.text(cx, VY + 0.55, "methylation · the measured layer", ha="center", color=gray, fontsize=8.5, style="italic")

legend = [Line2D([0], [0], marker="o", color="none", markerfacecolor=coral, markeredgecolor=coral,
                 markersize=8, label="methylated CpG"),
          Line2D([0], [0], marker="o", color="none", markerfacecolor="white", markeredgecolor=navy,
                 markersize=8, label="unmethylated CpG")]
ax.legend(handles=legend, loc="upper left", bbox_to_anchor=(0.005, 1.0), frameon=False,
          fontsize=8.8, ncol=1, handletextpad=0.5)

titles = ["1 · Colon segment", "2 · Mucosa and crypts", "3 · Epithelial cell", "4 · Promoter CpGs"]
notes = ["Visible inflammation.\nDysplasia is often flat\nand not visible at all.",
         "Histology sees architecture\nand grade, one biopsy site\nat a time.",
         "Cell identity and state.\nAlso what cfDNA carries\nout of the tissue.",
         "Read-level methylation:\nmeasurable in tissue DNA\nand in plasma cfDNA."]
for x, t, n in zip(vp_x, titles, notes):
    ax.text(x + VW / 2, VY - 0.32, t, ha="center", color=navy, weight="bold", fontsize=10.5)
    ax.text(x + VW / 2, VY - 1.55, n, ha="center", va="center", color="#3c4a52", fontsize=8.8, linespacing=1.45)

ax.add_patch(FancyArrowPatch((0.5, 0.55), (15.5, 0.55), arrowstyle="-|>", mutation_scale=16,
                             color=gray, lw=1.4))
for x, s in zip([vp_x[i] + VW / 2 for i in range(4)], ["≈ 30 cm", "≈ 1 mm", "≈ 10 µm", "≈ 300 bp"]):
    ax.text(x, 0.78, s, ha="center", color=gray, fontsize=8.5)
ax.text(8.0, 7.05, "One participant, four scales — the endoscope resolves the first two",
        ha="center", color=navy, weight="bold", fontsize=12.5)
fig.tight_layout(); fig.savefig(OUT / "figure-1-zoom-cascade.png", dpi=220, bbox_inches="tight")
plt.show()
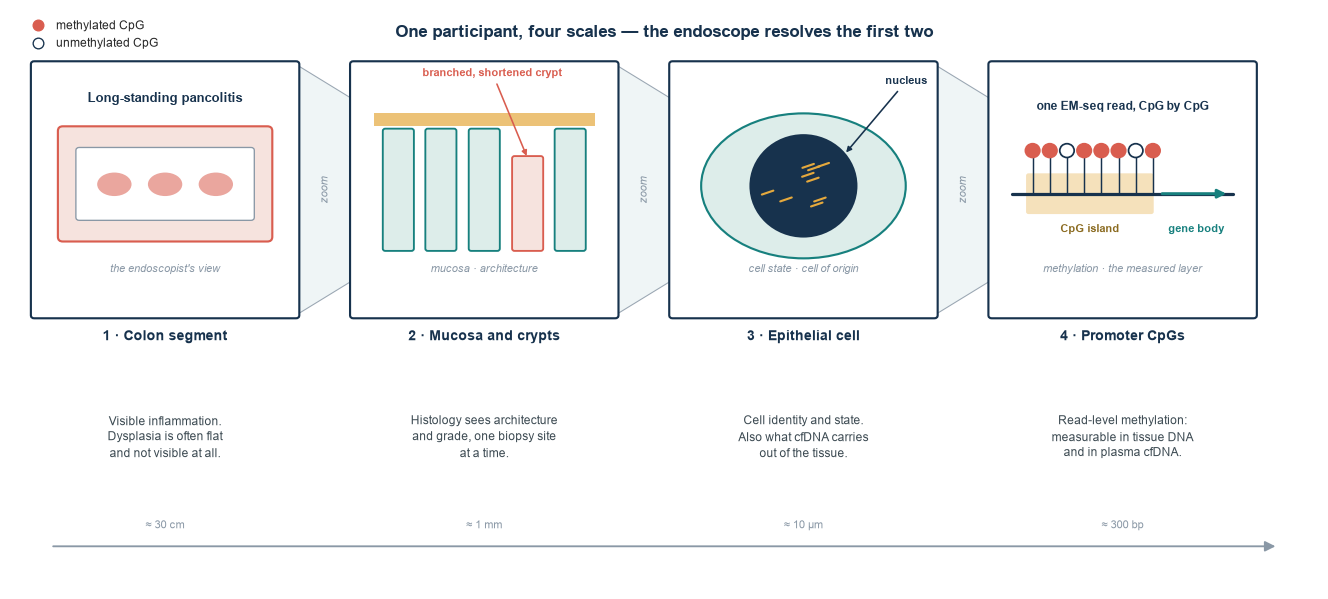
Figure 1: From the endoscopist’s field of view to a single CpG. The methylation signal is a property of individual DNA molecules; it is not something that can be seen, and that is precisely why it might add information to an examination that relies on sight.

Which clinical problem is actually unsolved?

The gap is specific and it is a coverage gap, not a technology gap. A blood-based cell-free DNA test detected colorectal cancer with 83% sensitivity at 90% specificity for advanced neoplasia in 7,861 average-risk adults, though sensitivity for advanced precancerous lesions was only 13% (Chung, Gray, Singh, and others, 2024). The next-generation stool DNA test reached 93.9% sensitivity for cancer and 43.4% for advanced precancerous lesions in 20,176 participants, at 90.6% specificity for advanced neoplasia (Imperiale, Porter, Zella, and others, 2024). These are strong screening tests. They are also, by label, for people whose colons are not chronically inflamed—and chronic inflammation is exactly the condition that changes both the biology and the base rate.

So the unsolved problem is not “detect colorectal cancer non-invasively”; that problem now has approved answers for the general population. The unsolved problem is risk stratification inside an already-high-risk group whose mucosa is abnormal by definition. A patient with 20 years of extensive colitis does not need to be told they are at elevated risk—they already know. They need to know whether this year their colon is carrying a molecular field change that warrants a closer look, and no approved test speaks to that question.

Why a 14-gene fingerprint rather than a single marker?

Because the two things a clinician would want to separate—inflammation and neoplastic drift—are not separable by one locus. The panel deliberately spans several biological programmes: immune activation and restraint (CD86, IL10, NLRC4, NLRP3, SIGLEC5, CLMP), epithelial cohesion (CDH1, CLMP), the cell-cycle brake (CDKN2A), trophic signalling (GDNF), and neoplasia-associated markers with weaker mechanistic annotation (FOXE1, SYNE1, FAM217B, KIAA1614, RIBC2). The Reactome synthesis shows why that spread matters and where the annotation runs out; the individual gene profiles give the evidence behind each.

The precedent for multiplexing is direct. In the ENDCaP-C validation, a five-marker methylation panel detected pre-cancerous and invasive neoplasia in neoplastic mucosa with an AUC of 0.83, while a four-marker panel applied to non-neoplastic mucosa predicted associated bowel neoplasia with an AUC of 0.68—modest, but non-zero, from tissue that looked normal (Beggs, Mehta, Deeks, and others, 2019). Methylation of TUBB6 discriminated dysplastic from non-dysplastic tissue with an AUC of 0.84, including in apparently normal field mucosa downstream of a lesion (Beggs, James, Caldwell, and others, 2018). A field signal that survives in normal-looking mucosa is exactly the kind of signal that could in principle survive into plasma.

Why validate the same fingerprint in tissue and plasma?

Because they answer different halves of the question. Colonic tissue anchors the signal anatomically: if a differential methylation region shows up in the biopsy, it is at least coming from the organ of interest. Plasma is the specimen a clinic could realistically draw every six months, but it is a mixture—leukocyte-derived cell-free DNA usually dominates, and a colonic epithelial signal has to be detected against that background. Neither view is sufficient alone, which is why the study collects both from the same participant; the reasoning is set out in why pair tissue and plasma.

Pairing turns concordance into an internal validation gate rather than an assumption. If a region is differentially methylated in tissue and the same direction of change is visible in that participant’s plasma, the plasma signal has an anatomical explanation. If it is visible only in tissue, the assay may lack sensitivity at realistic tumour or epithelial fractions. If it is visible only in plasma, the likeliest explanation is cell-of-origin contamination, not a discovery. Each of those three outcomes is informative, and only the paired design can tell them apart.

Show reproducible Python code
fig, ax = plt.subplots(figsize=(14, 7.0))
ax.set(xlim=(0, 17.4), ylim=(0, 8.6)); ax.axis("off")

BW, BH = 2.05, 1.0
cols = [0.35, 2.75, 5.15, 7.55, 9.95, 12.35]
lane = {"tissue": 6.10, "plasma": 4.10, "serum": 1.30}
GX, GW = 14.95, 2.05

def box(x, y, txt, fc, ec=None, tc="white", ls="solid", fs=8.8, w=BW, h=BH):
    ax.add_patch(FancyBboxPatch((x, y), w, h, boxstyle="round,pad=0.06", fc=fc,
                                ec=ec if ec else "none", lw=1.6, linestyle=ls, zorder=2))
    ax.text(x + w / 2, y + h / 2, txt, ha="center", va="center", color=tc,
            weight="bold", fontsize=fs, linespacing=1.35, zorder=3)

def arrow(x0, y0, x1, y1, col=navy, lw=1.9, ls="-"):
    ax.add_patch(FancyArrowPatch((x0, y0), (x1, y1), arrowstyle="-|>", mutation_scale=14,
                                 color=col, lw=lw, linestyle=ls, zorder=2))

# lane bands
for name, y in lane.items():
    width = 14.4 if name != "serum" else 4.65
    ax.add_patch(Rectangle((0.15, y - 0.42), width, BH + 0.84, fc=pale, ec="none", alpha=0.55, zorder=0))

# tissue lane
box(cols[0], lane["tissue"], "Colonic\nbiopsy", teal)
box(cols[1], lane["tissue"], "PANAMAX 48\ngenomic DNA", teal)
box(cols[2], lane["tissue"], "UltraShear\nfragmentation", gold, tc=navy)
box(cols[3], lane["tissue"], "NEBNext\nEM-seq", navy)
box(cols[4], lane["tissue"], "NovaSeq 6000\npaired-end", navy)
box(cols[5], lane["tissue"], "fastp → bwa-meth\n→ MethylDackel", navy)
for i in range(5):
    arrow(cols[i] + BW, lane["tissue"] + BH / 2, cols[i + 1], lane["tissue"] + BH / 2)

# plasma lane
box(cols[0], lane["plasma"], "Blood draw\n(plasma)", coral)
box(cols[1], lane["plasma"], "PANAMAX 48\ncfDNA", coral)
box(cols[2], lane["plasma"], "no shearing —\nnative inserts kept", "white", ec=coral, tc=coral, ls="dashed")
box(cols[3], lane["plasma"], "NEBNext\nEM-seq", navy)
box(cols[4], lane["plasma"], "NovaSeq 6000\npaired-end", navy)
box(cols[5], lane["plasma"], "fastp → bwa-meth\n→ MethylDackel", navy)
for i in range(5):
    arrow(cols[i] + BW, lane["plasma"] + BH / 2, cols[i + 1], lane["plasma"] + BH / 2, col=coral)

# serum lane
box(cols[0], lane["serum"], "Blood draw\n(serum)", "#B4762F")
box(cols[1], lane["serum"], "sIgA sandwich\nELISA", "#B4762F")
arrow(cols[0] + BW, lane["serum"] + BH / 2, cols[1], lane["serum"] + BH / 2, col="#B4762F")

# convergence
box(GX, 3.55, "DSS\nDML / DMR\n+ integration", navy, w=GW, h=3.10, fs=9.6)
for y, c in [(lane["tissue"], teal), (lane["plasma"], coral)]:
    arrow(cols[5] + BW, y + BH / 2, GX, 5.65 if y == lane["tissue"] else 4.90, col=c)
arrow(cols[1] + BW, lane["serum"] + BH / 2, GX + GW / 2, lane["serum"] + BH / 2,
      col="#B4762F", ls=(0, (5, 3)))
arrow(GX + GW / 2, lane["serum"] + BH / 2, GX + GW / 2, 3.55, col="#B4762F", ls=(0, (5, 3)))

ax.text(GX + GW / 2, 7.95, "Paired concordance gate", ha="center", color=navy, weight="bold", fontsize=10)
ax.text(GX + GW / 2, 7.28, "same direction in tissue\nand plasma, same person?", ha="center", va="center",
        color="#3c4a52", fontsize=8.4, linespacing=1.4)

ax.annotate("cfDNA is never sheared — insert size\nis itself a measurement",
            xy=(cols[2] + BW / 2, lane["plasma"]), xytext=(cols[2] + BW / 2, 2.95),
            ha="center", color=coral, fontsize=8.6, weight="bold",
            arrowprops=dict(arrowstyle="-|>", color=coral, lw=1.2))
ax.annotate("tissue DNA is sheared on purpose,\nto match library input",
            xy=(cols[2] + BW / 2, lane["tissue"] + BH), xytext=(cols[2] + BW / 2, 7.90),
            ha="center", color="#8a6a1f", fontsize=8.6, weight="bold",
            arrowprops=dict(arrowstyle="-|>", color=gold, lw=1.2))

for name, label, col in [("tissue", "TISSUE", teal), ("plasma", "PLASMA cfDNA", coral),
                         ("serum", "SERUM", "#B4762F")]:
    ax.text(0.22, lane[name] + BH + 0.52, label, ha="left", color=col, weight="bold", fontsize=8.6)

ax.text(8.7, 0.32, "One collection episode · two specimens from the same participant · one integrated model",
        ha="center", color=gray, fontsize=9.5, style="italic")
fig.tight_layout(); fig.savefig(OUT / "figure-2-clinical-workflow.png", dpi=220, bbox_inches="tight")
plt.show()
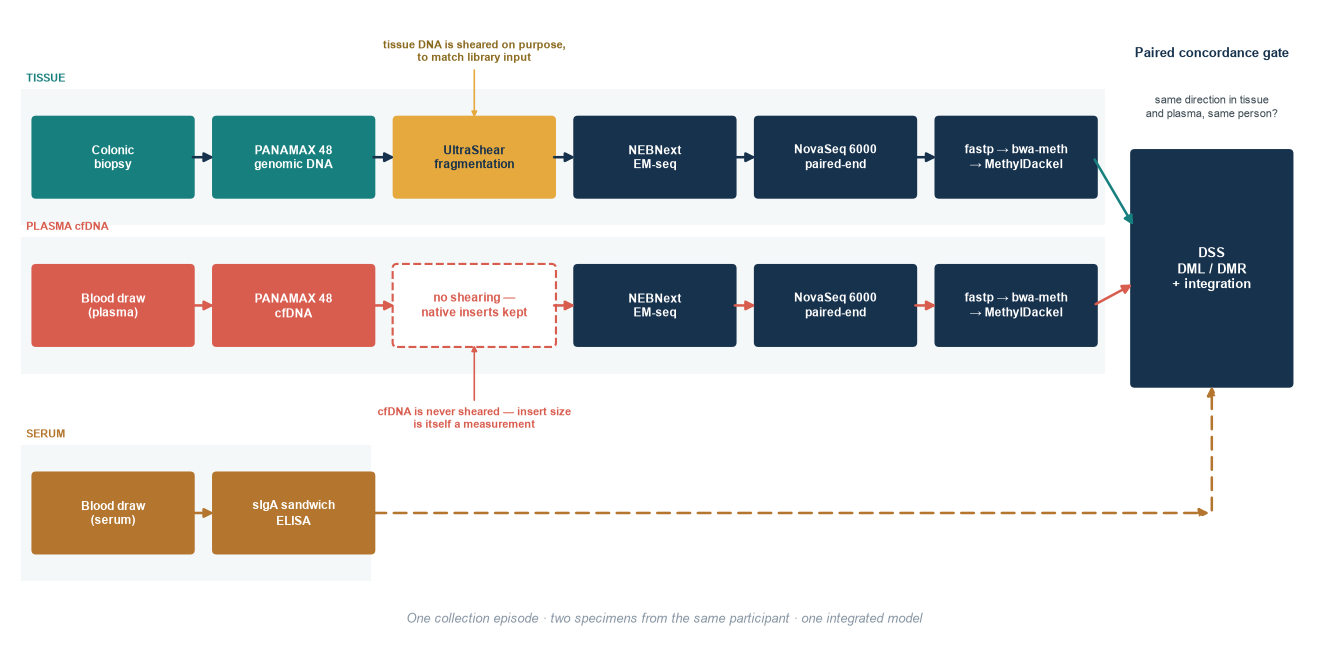
Figure 2: One participant, three specimens, one integrated readout. Tissue DNA is deliberately sheared and plasma cfDNA is not, because native insert-size distribution is the raw material for any later fragmentomic analysis. The paired concordance check is the gate, not an afterthought.

What does serum sIgA add that methylation cannot?

It measures a different thing. Methylation reports on cell state and cell of origin; secretory IgA reports on the mucosal immune barrier and its interaction with the microbiota. In a clinic, the practical value of an orthogonal axis is discrimination between two situations that look similar on an inflammatory marker alone: a colon that is inflamed, and a colon that is inflamed and drifting. If methylation and sIgA move together in all patients, sIgA adds little; if they dissociate in a subgroup, that dissociation is the clinically interesting signal. The assay and rationale set out how it is measured here.

Two caveats have to travel with any sIgA claim. First, this study measures serum sIgA, which is accessible but is not the same measurement as secretory IgA at the intestinal surface or in stool—that distinction is stated plainly in the methylation vs sIgA comparison and it does not go away when the result is convenient. Second, a serum immune marker is dynamic: infection, treatment, and systemic immune state all move it. That makes it a plausible complement to a durable epigenetic signal and a poor substitute for one.

Where would such a test sit in a care pathway?

Three placements are worth distinguishing, because they have different evidence requirements. Triage before colonoscopy would use the test to prioritise scarce endoscopy slots—it needs high sensitivity and tolerates modest specificity, because the downstream action is a procedure the patient was going to need eventually. Surveillance-interval personalisation would use a persistently negative result to justify extending an interval, and that is the most demanding use: it requires prospective, longitudinal evidence that a negative result predicts absence of progression, not merely absence of current dysplasia. Post-treatment or post-resection monitoring would track the signal over time within one patient, where each person is their own baseline and the relevant question is change rather than an absolute threshold.

None of these is a replacement for colonoscopy, and the framing matters clinically. A methylation field signal, by construction, says something about the state of the mucosa as a whole; it does not localise a lesion, and a positive result still ends in an endoscope. The realistic ambition is to change who gets scoped next and when, not to remove the procedure from the pathway.

Show reproducible Python code
fig, ax = plt.subplots(figsize=(14, 7.2))
ax.set(xlim=(0, 16), ylim=(0, 8.4)); ax.axis("off")

def pbox(x, y, w, h, txt, fc, tc="white", ec="none", ls="solid", fs=9.0):
    ax.add_patch(FancyBboxPatch((x, y), w, h, boxstyle="round,pad=0.07", fc=fc, ec=ec,
                                lw=1.7, linestyle=ls, zorder=2))
    ax.text(x + w / 2, y + h / 2, txt, ha="center", va="center", color=tc, weight="bold",
            fontsize=fs, linespacing=1.35, zorder=3)

def parrow(x0, y0, x1, y1, col=navy, ls="-", lw=2.0):
    ax.add_patch(FancyArrowPatch((x0, y0), (x1, y1), arrowstyle="-|>", mutation_scale=15,
                                 color=col, lw=lw, linestyle=ls, zorder=2))

# --- current pathway
ax.add_patch(Rectangle((0.15, 5.55), 15.7, 2.55, fc=pale, ec="none", alpha=0.6, zorder=0))
ax.text(0.35, 7.86, "TODAY  ·  evidence-supported practice", color=teal, weight="bold", fontsize=10)
pbox(0.4, 6.15, 2.5, 1.25, "Long-standing\nextensive UC", teal)
pbox(3.6, 6.15, 2.7, 1.25, "Risk stratification\nfrom history and\nendoscopic appearance", teal)
pbox(7.0, 6.15, 2.7, 1.25, "Surveillance\ncolonoscopy at a\nfixed interval", teal)
pbox(10.4, 6.15, 2.5, 1.25, "Targeted ± random\nbiopsy", teal)
pbox(13.6, 6.15, 2.1, 1.25, "Histology\ndecides", navy)
for x0, x1 in [(2.9, 3.6), (6.3, 7.0), (9.7, 10.4), (12.9, 13.6)]:
    parrow(x0, 6.78, x1, 6.78, col=teal)

# divider
ax.plot([0.2, 15.8], [5.25, 5.25], color=gray, lw=1.1, linestyle=(0, (6, 4)))
ax.text(8.0, 5.42, "everything below this line is hypothetical", ha="center", color=gray,
        fontsize=9, style="italic")

# --- hypothesised pathway
ax.text(0.35, 4.78, "HYPOTHESISED  ·  would require prospective validation", color=coral,
        weight="bold", fontsize=10)
pbox(0.4, 2.95, 2.5, 1.25, "Same patient,\nsame clinic visit", coral)
pbox(3.6, 2.95, 2.9, 1.25, "Blood draw:\ncfDNA methylation\npanel + serum sIgA", coral)
pbox(7.2, 2.95, 2.6, 1.25, "Integrated\nrisk score", navy)
for x0, x1 in [(2.9, 3.6), (6.5, 7.2)]:
    parrow(x0, 3.58, x1, 3.58, col=coral)

pbox(11.0, 3.50, 4.7, 1.20, "Signal present → bring colonoscopy forward,\nchromoendoscopy, extended sampling", gold, tc=navy, fs=9.0)
pbox(11.0, 1.65, 4.7, 1.20, "Signal absent → maintain the guideline interval\n(never: skip surveillance)", "white", tc=navy, ec=navy, ls="dashed", fs=9.0)
parrow(9.8, 3.90, 11.0, 4.10, col=gold)
parrow(9.8, 3.30, 11.0, 2.25, col=navy, ls=(0, (5, 3)))
ax.text(10.42, 4.20, "positive", ha="center", color="#8a6a1f", fontsize=8.6, weight="bold")
ax.text(10.32, 2.42, "negative", ha="center", color=navy, fontsize=8.6, weight="bold")

pbox(0.4, 0.35, 6.1, 1.15, "Repeat at each visit — within-person change,\nnot a single absolute threshold", "white",
     tc=teal, ec=teal, ls="dashed", fs=9.0)
parrow(3.45, 2.95, 3.45, 1.50, col=teal, ls=(0, (5, 3)))

ax.annotate("the test reprioritises the queue;\nit does not remove the procedure",
            xy=(11.0, 3.70), xytext=(8.6, 0.72), ha="center", color=coral, fontsize=9.2,
            weight="bold", arrowprops=dict(arrowstyle="-|>", color=coral, lw=1.3,
                                           connectionstyle="arc3,rad=-0.28"))
ax.text(8.0, 8.15, "Where a methylation + sIgA score could enter the surveillance pathway",
        ha="center", color=navy, weight="bold", fontsize=12.5)
fig.tight_layout(); fig.savefig(OUT / "figure-4-care-pathway.png", dpi=220, bbox_inches="tight")
plt.show()
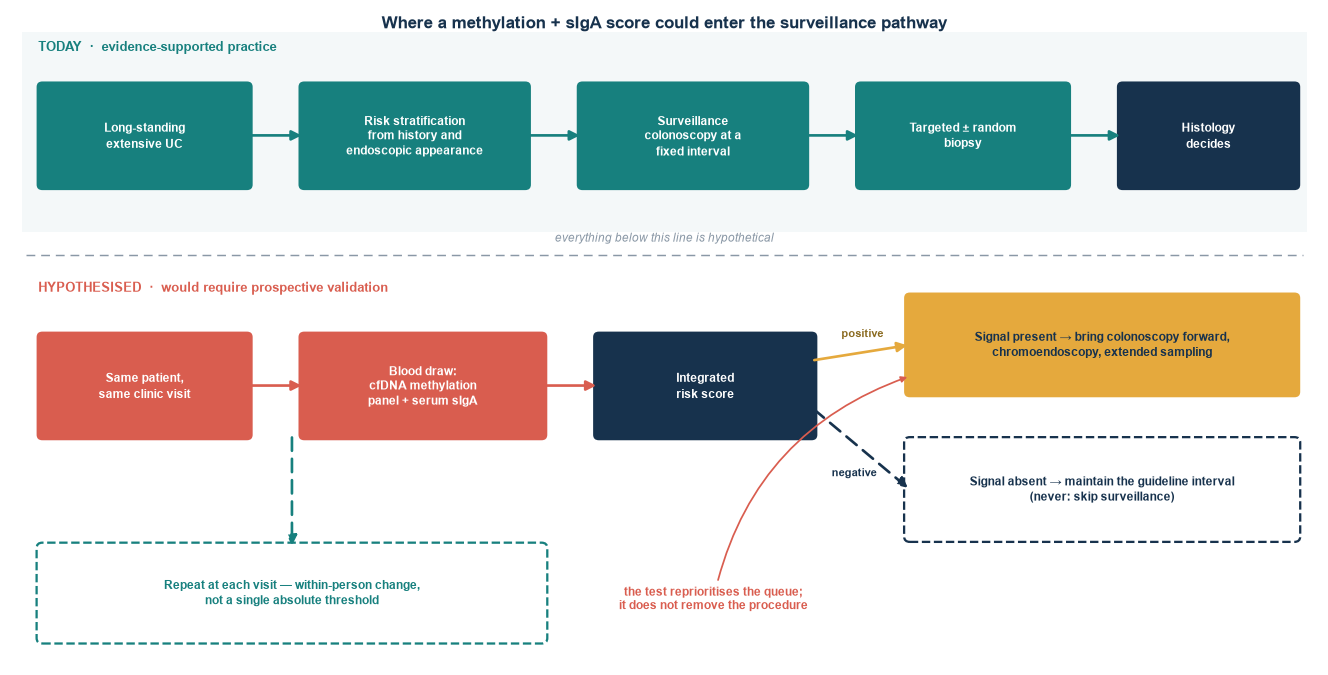
Figure 3: Current surveillance pathway (top) and the hypothesised augmented pathway (bottom). The lower row is a design proposal, not a validated algorithm: every arrow below the divider would require prospective evidence that does not yet exist.

What performance would it actually need to change a decision?

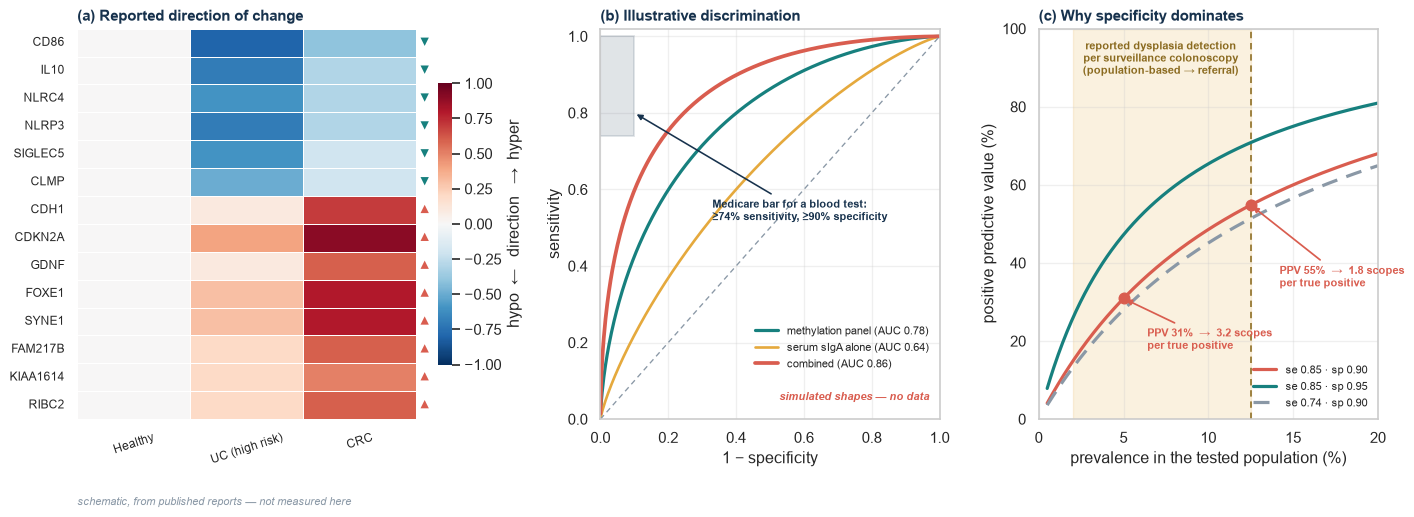
There is a published bar to clear. Medicare’s national coverage determination for colorectal cancer screening tests (NCD 210.3) requires a blood-based biomarker screening test to show at least 74% sensitivity for colorectal cancer and at least 90% specificity, based on the pivotal studies in FDA labelling, and covers such a test once every three years. That bar was calibrated against average-risk screening, and a surveillance test for high-risk colitis would ultimately need its own threshold—but it is the only concrete number the field has, and it is a reasonable place to start reasoning.

Specificity is the constraint that bites, and how hard it bites depends on prevalence—which in surveillance is neither negligible nor well pinned down. Reported per-procedure dysplasia detection varies widely with population and technique: a real-world Latin American surveillance series spanning Colombia, Costa Rica, Peru, Ecuador and the Dominican Republic found dysplasia in 12.5% of 144 surveillance colonoscopies, with digital chromoendoscopy detecting roughly five times more than white light (Parra-Izquierdo, Otero-Regino, Juliao-Baños, and others, 2025), while population-based cohorts report considerably lower rates (Choi, Rutter, Askari, and others, 2015). That spread matters more than any single figure, and it cuts in the technology’s favour: a surveillance population is enriched relative to average-risk screening, so the same test yields a better positive predictive value here than it would in a screening programme.

The arithmetic is still worth seeing before a test is called “accurate”. At 5% prevalence, a test with 85% sensitivity and 90% specificity returns a positive predictive value near 31%—about three colonoscopies per true finding. At the 12.5% observed in that Latin American series, the same test returns roughly 55%. Figure 4 shows the whole curve rather than a single operating point, because the honest answer depends on which population is being tested.

WarningSimulation disclaimer

Panels (b) and (c) of Figure 4 contain no data from this study or any other. Panel (b) is drawn from a binormal model at chosen AUC values to illustrate the shape of the trade-off. Panel (c) is exact arithmetic — Bayes’ rule applied to stated sensitivity and specificity — and is true of any test with those characteristics, including tests that do not exist.

ImportantWhat panel (a) is—and is not

Panel (a) encodes the direction of methylation change reported in the cited literature for each panel gene, on a schematic scale. It is a reading of published findings (Kang, Bae, Han, Kim, Kim, and Yi, 2016; Papadia, Louwagie, Del Rio, Grooteclaes, Coruzzi, Montana, Novelli, Bordi, de’ Angelis, Bassett, Bigley, Warren, Atkin, and Forbes, 2014; Saito, Kato, Hiraoka, Horii, Suzuki, Higashi, Kaji, Kondo, and Yamamoto, 2011; Hsieh, Klump, Holzmann, Borchard, Gregor, and Porschen, 1998; Wheeler, Kim, Efstathiou, Ilyas, Mortensen, and Bodmer, 2001), not a measurement from this cohort, and the magnitudes carry no quantitative meaning.

Show reproducible Python code
genes = ["CD86", "IL10", "NLRC4", "NLRP3", "SIGLEC5", "CLMP", "CDH1", "CDKN2A",
         "GDNF", "FOXE1", "SYNE1", "FAM217B", "KIAA1614", "RIBC2"]
# schematic direction: negative = hypomethylated, positive = hypermethylated
direction = pd.DataFrame(
    {"Healthy": [0] * 14,
     "UC (high risk)": [-0.8, -0.7, -0.6, -0.7, -0.6, -0.5, 0.1, 0.4, 0.1, 0.3, 0.3, 0.2, 0.2, 0.2],
     "CRC": [-0.4, -0.3, -0.3, -0.3, -0.2, -0.2, 0.7, 0.9, 0.6, 0.8, 0.8, 0.6, 0.5, 0.6]},
    index=genes)

def roc_from_auc(auc, n=400):
    """Binormal ROC with equal variances: the curve implied by a given AUC."""
    from scipy.stats import norm
    mu = np.sqrt(2) * norm.ppf(auc)
    fpr = np.linspace(1e-4, 1 - 1e-4, n)
    tpr = norm.cdf(norm.ppf(fpr) + mu)
    return fpr, tpr

def ppv(se, sp, prev):
    return se * prev / (se * prev + (1 - sp) * (1 - prev))

for pv in (0.05, 0.125):
    v = ppv(0.85, 0.90, pv)
    print(f"prevalence {pv:.1%}: PPV {v:.3f} → {1 / v:.1f} colonoscopies per true positive")

fig, axes = plt.subplots(1, 3, figsize=(15, 5.6),
                         gridspec_kw={"width_ratios": [1.25, 1.0, 1.0]})

# (a) direction map
axa = axes[0]
sns.heatmap(direction, ax=axa, cmap="RdBu_r", center=0, vmin=-1, vmax=1,
            cbar_kws={"label": "hypo  ←   direction   →  hyper", "shrink": 0.72},
            linewidths=0.6, linecolor="white", annot=False)
axa.set_title("(a) Reported direction of change", color=navy, weight="bold", loc="left", fontsize=11.5)
axa.set_xlabel(""); axa.tick_params(axis="x", rotation=18, labelsize=9)
axa.tick_params(axis="y", rotation=0, labelsize=9)
for i, g in enumerate(genes):
    mark = "▼" if direction["UC (high risk)"].iloc[i] < 0 else "▲"
    axa.text(3.02, i + 0.5, mark, va="center", ha="left",
             color=teal if mark == "▼" else coral, fontsize=9, clip_on=False)
axa.text(0.0, -0.22, "schematic, from published reports — not measured here",
         transform=axa.transAxes, color=gray, fontsize=8.4, style="italic")

# (b) illustrative ROC
axb = axes[1]
axb.set_facecolor("white"); axb.grid(alpha=0.3)
for auc, lab, col, lw in [(0.78, "methylation panel", teal, 2.4),
                          (0.64, "serum sIgA alone", gold, 2.0),
                          (0.86, "combined", coral, 2.8)]:
    f, t = roc_from_auc(auc)
    axb.plot(f, t, color=col, lw=lw, label=f"{lab} (AUC {auc:.2f})")
axb.plot([0, 1], [0, 1], color=gray, lw=1.0, linestyle=(0, (4, 3)))
axb.add_patch(Rectangle((0, 0.74), 0.10, 0.26, fc=navy, ec=navy, alpha=0.13, lw=1.4, zorder=1))
axb.annotate("Medicare bar for a blood test:\n≥74% sensitivity, ≥90% specificity",
             xy=(0.10, 0.80), xytext=(0.33, 0.52), fontsize=8.6, color=navy, weight="bold",
             arrowprops=dict(arrowstyle="-|>", color=navy, lw=1.2))
axb.set(xlim=(0, 1), ylim=(0, 1.02), xlabel="1 − specificity", ylabel="sensitivity")
axb.set_title("(b) Illustrative discrimination", color=navy, weight="bold", loc="left", fontsize=11.5)
axb.legend(loc="lower right", bbox_to_anchor=(1.0, 0.10), frameon=False, fontsize=8.6)
axb.text(0.97, 0.05, "simulated shapes — no data", ha="right", color=coral, fontsize=8.4,
         style="italic", weight="bold")

# (c) PPV vs prevalence
axc = axes[2]
axc.set_facecolor("white"); axc.grid(alpha=0.3)
prev = np.linspace(0.005, 0.20, 300)
for se, sp, col, ls in [(0.85, 0.90, coral, "-"), (0.85, 0.95, teal, "-"), (0.74, 0.90, gray, (0, (5, 3)))]:
    axc.plot(prev * 100, ppv(se, sp, prev) * 100, color=col, lw=2.4, linestyle=ls,
             label=f"se {se:.2f} · sp {sp:.2f}")
axc.axvspan(2, 12.5, color=gold, alpha=0.16, zorder=0)
axc.text(7.2, 97, "reported dysplasia detection\nper surveillance colonoscopy\n(population-based → referral)",
         ha="center", va="top", color="#8a6a1f", fontsize=8.4, weight="bold")
axc.axvline(12.5, color="#8a6a1f", lw=1.2, linestyle=(0, (4, 3)), zorder=1)
for p0, dx, dy in [(0.05, 6.4, 18), (0.125, 14.2, 34)]:
    y0 = ppv(0.85, 0.90, p0) * 100
    axc.plot([p0 * 100], [y0], marker="o", color=coral, ms=8, zorder=5)
    axc.annotate(f"PPV {y0:.0f}%  →  {100 / y0:.1f} scopes\nper true positive",
                 xy=(p0 * 100, y0), xytext=(dx, dy), fontsize=8.6, color=coral, weight="bold",
                 arrowprops=dict(arrowstyle="-|>", color=coral, lw=1.3))
axc.set(xlim=(0, 20), ylim=(0, 100), xlabel="prevalence in the tested population (%)",
        ylabel="positive predictive value (%)")
axc.set_title("(c) Why specificity dominates", color=navy, weight="bold", loc="left", fontsize=11.5)
axc.legend(loc="lower right", frameon=False, fontsize=8.6)

fig.tight_layout(); fig.savefig(OUT / "figure-3-performance.png", dpi=220, bbox_inches="tight")
plt.show()
prevalence 5.0%: PPV 0.309 → 3.2 colonoscopies per true positive
prevalence 12.5%: PPV 0.548 → 1.8 colonoscopies per true positive
Figure 4: (a) Direction of methylation change reported in the literature for each panel gene. (b) Illustrative discrimination for methylation alone, sIgA alone, and the two combined, with the Medicare blood-test operating region marked. (c) Positive predictive value against prevalence — exact arithmetic, showing why specificity dominates in a low-prevalence surveillance setting.

How does this compare with what is already on the market?

The table below is a clinical-indication landscape; the cfDNA technology landscape covers the same companies from the platform side. Read the indicated population column first—it is where the gap lives.

Test / platform Specimen Signal Status Indicated population Relevance and gap for UC surveillance
Cologuard Plus (Exact Sciences) Stool Methylated DNA markers + haemoglobin FDA-approved Oct 2024 Average risk, ≥45 93.9% cancer sensitivity, 43.4% for advanced precancerous lesions (Imperiale, Porter, Zella, and others, 2024). IBD is a listed contraindication; the test was not evaluated in inflamed mucosa.
Shield (Guardant Health) Plasma cfDNA (methylation and related features) FDA-approved Jul 2024 Average risk, ≥45 83% cancer sensitivity, 90% specificity, 13% for advanced precancerous lesions (Chung, Gray, Singh, and others, 2024). Proves a blood test can be approved; says nothing about UC.
Epi proColon (methylated SEPT9) Plasma Single methylation marker Earlier-generation blood test Average-risk screening 48.2% sensitivity, 91.5% specificity, 11.2% for advanced adenoma (Church, Wandell, Lofton-Day, and others, 2014). The clearest evidence that one marker is not enough.
Galleri (GRAIL) Plasma Targeted methylation, multi-cancer Laboratory-developed test Adults at elevated cancer risk; complements screening 51.5% overall sensitivity at 99.5% specificity; 16.8% at stage I (Klein, Richards, Cohn, and others, 2021). Built for many cancers at high specificity, not for one organ at high sensitivity.
DELFI Plasma Genome-wide fragmentation Research / commercial development Cancer detection research Fragmentomics is a complementary cfDNA feature (Cristiano, Leal, Phallen, and others, 2019). Inflammation itself perturbs fragmentation, so a colitis cohort needs its own baseline.
LiquiPath / Activace (Tagomics) Plasma Cell-type methylation atlas deconvolution Early access, drug-safety monitoring Organ-injury monitoring The closest analogue to tissue-of-origin deconvolution; company-reported and not independently validated for colon.
Monitr / Endoscopic Healing Index (Prometheus) Serum 13-protein panel Laboratory-developed test Crohn’s disease AUROC 0.962 in biologic-naive early disease but 0.693 in chronic disease (D’Haens, Kelly, Battat, and others, 2020). Measures inflammation, not neoplastic drift — and it is a Crohn’s test.
Fecal calprotectin Stool Neutrophil protein Routine clinical use IBD activity monitoring Pooled sensitivity 0.88, specificity 0.73 for endoscopic activity (Mosli, Zou, Garg, and others, 2015). Excellent for inflammation; silent on dysplasia.
Chromoendoscopy + targeted biopsy Colon Visual + histology Guideline-recommended IBD surveillance The reference standard (Laine, Kaltenbach, Barkun, and others, 2015; Murthy, Feuerstein, Nguyen, and Velayos, 2021). Twice as effective as white light for dysplasia, and still misses field change (Choi, Rutter, Askari, and others, 2015).
This project Tissue + plasma + serum 14-gene methylation, paired, plus serum sIgA Exploratory, 18 participants High-risk UC (research only) Addresses the population everything above excludes. Has produced no performance estimate, and cannot until it is much larger.

What would make it fail?

Four things, in rough order of likelihood. Inflammation confounds methylation: several panel genes were nominated because they change with disease severity, which is exactly what makes them poor at distinguishing “severely inflamed” from “neoplastically drifting”. Leukocyte cfDNA dominates plasma: if the colonic epithelial fraction is small, a real tissue signal may simply be undetectable at achievable sequencing depth, and tissue-of-origin deconvolution becomes a prerequisite rather than a refinement. Batch and pre-analytics masquerade as biology: collection tube, processing delay, freeze–thaw, and library batch can all generate group differences in a cohort this size. The cohort is too small for the question: with 18 participants across three groups, this design can estimate effect sizes and check assay behaviour; it cannot estimate sensitivity, and any classifier trained on it will overfit.

There is also a conceptual limit that no amount of data removes. A field-change marker reports on the state of the mucosa, not the location of a lesion. Even a well-performing test would end in a colonoscopy, and its value would have to be argued in terms of better-targeted endoscopy rather than less endoscopy.

What is the shortest credible path to a clinic?

Each rung requires a different study, and the study described on this site sits on the first. Association—do the signals differ across groups?—is answerable now. Discrimination in held-out data needs a cohort perhaps an order of magnitude larger, with pre-specified regions and honest resampling. Prognosis needs longitudinal follow-up in a surveillance programme, because the clinically relevant outcome is progression, not cross-sectional group membership. Clinical utility needs a comparison against the current pathway, and reimbursement needs performance characteristics documented in a form a payer recognises.

Show reproducible Python code
flowchart LR
  A["1 · Association<br/>signals differ across groups"] --> B["2 · Discrimination<br/>held-out and external cohorts"]
  B --> C["3 · Prognosis<br/>prospective surveillance follow-up"]
  C --> D["4 · Clinical utility<br/>better decisions than current care"]
  D --> E["5 · Deployment<br/>CLIA / regulatory / coverage"]

  classDef now fill:#dcefee,stroke:#167d78,color:#123b5d;
  classDef next fill:#f7efe1,stroke:#c58b2c,color:#3c2d16;
  classDef far fill:#123b5d,stroke:#123b5d,color:#fff;
  class A now;
  class B,C next;
  class D,E far;

flowchart LR
  A["1 · Association<br/>signals differ across groups"] --> B["2 · Discrimination<br/>held-out and external cohorts"]
  B --> C["3 · Prognosis<br/>prospective surveillance follow-up"]
  C --> D["4 · Clinical utility<br/>better decisions than current care"]
  D --> E["5 · Deployment<br/>CLIA / regulatory / coverage"]

  classDef now fill:#dcefee,stroke:#167d78,color:#123b5d;
  classDef next fill:#f7efe1,stroke:#c58b2c,color:#3c2d16;
  classDef far fill:#123b5d,stroke:#123b5d,color:#fff;
  class A now;
  class B,C next;
  class D,E far;

The honest summary is that the clinical problem is real, well-characterised, and unaddressed by any approved test, and that this project is at rung one of five. That is a reason to be precise about which rung each claim belongs to, not a reason to discount the question.

ImportantTranslation boundary

This post describes clinical problems an integrated methylation and sIgA signal could address if it validated. It reports no performance from this cohort, provides no medical advice, and is not evidence that methylation or serum sIgA predicts an individual’s cancer risk. Nothing here supports substituting any measurement for colonoscopic surveillance in inflammatory bowel disease. The named commercial tests are described by their published indications and evidence; none is endorsed, and none is indicated for ulcerative colitis surveillance.

Back to Field Notes → · cfDNA technology landscape → · Methylation vs sIgA →

Back to top

References

Daniel C. Chung, Darrell M. Gray, Harminder Singh, and others. (2024). A cell-free DNA blood-based test for colorectal cancer screening. New England Journal of Medicine. https://doi.org/10.1056/NEJMoa2304714.
Thomas F. Imperiale, Kyle Porter, Julia Zella, and others. (2024). Next-generation multitarget stool DNA test for colorectal cancer screening. New England Journal of Medicine. https://doi.org/10.1056/NEJMoa2310336.
Loren Laine, Tonya Kaltenbach, Alan Barkun, and others. (2015). SCENIC international consensus statement on surveillance and management of dysplasia in inflammatory bowel disease. Gastroenterology. https://doi.org/10.1053/j.gastro.2015.01.031.
Sanjay K. Murthy, Joseph D. Feuerstein, Geoffrey C. Nguyen, and Fernando S. Velayos. (2021). AGA clinical practice update on endoscopic surveillance and management of colorectal dysplasia in inflammatory bowel diseases: Expert review. Gastroenterology. https://doi.org/10.1053/j.gastro.2021.05.063.
Chang-Ho Ryan Choi, Matthew D. Rutter, Alan Askari, and others. (2015). Forty-year analysis of colonoscopic surveillance program for neoplasia in ulcerative colitis: An updated overview. American Journal of Gastroenterology. https://doi.org/10.1038/ajg.2015.65.
Ola Olén, Rune Erichsen, Michael C. Sachs, and others. (2020). Colorectal cancer in ulcerative colitis: A scandinavian population-based cohort study. The Lancet. https://doi.org/10.1016/S0140-6736(19)32545-0.
Andrew D. Beggs, Samir Mehta, Jonathan J. Deeks, and others. (2019). Validation of epigenetic markers to identify colitis associated cancer: Results of module 1 of the ENDCAP-c study. EBioMedicine. https://doi.org/10.1016/j.ebiom.2018.11.034.
Andrew D. Beggs, Jonathan James, Germaine Caldwell, and others. (2018). Discovery and validation of methylation biomarkers for ulcerative colitis associated neoplasia. Inflammatory Bowel Diseases. https://doi.org/10.1093/ibd/izy119.
Viviana Parra-Izquierdo, William Otero-Regino, Fabian Juliao-Baños, and others. (2025). Dysplasia and colorectal cancer surveillance in ulcerative colitis patients in latin america: Real-world data. Crohn’s & Colitis 360. https://doi.org/10.1093/crocol/otae081.
Keunsoo Kang, Jin-Han Bae, Kyudong Han, Eun Soo Kim, Tae-Oh Kim, and Joo Mi Yi. (2016). A genome-wide methylation approach identifies a new hypermethylated gene panel in ulcerative colitis. International Journal of Molecular Sciences. https://doi.org/10.3390/ijms17081291.
Cinzia Papadia, Joost Louwagie, Paolo Del Rio, Madeleine Grooteclaes, Alessandro Coruzzi, Chiara Montana, Marco Novelli, Cesare Bordi, Gian Luigi de’ Angelis, Paul Bassett, Joseph Bigley, Bryan Warren, Wendy Atkin, and Alastair Forbes. (2014). FOXE1 and SYNE1 genes hypermethylation panel as promising biomarker in colitis-associated colorectal neoplasia. Inflammatory Bowel Diseases. https://doi.org/10.1097/01.MIB.0000435443.07237.ed.
Shunsuke Saito, Jun Kato, Sakiko Hiraoka, Joichiro Horii, Hideyuki Suzuki, Reiji Higashi, Eisuke Kaji, Yoshitaka Kondo, and Kazuhide Yamamoto. (2011). DNA methylation of colon mucosa in ulcerative colitis patients: Correlation with inflammatory status. Inflammatory Bowel Diseases. https://doi.org/10.1002/ibd.21573.
C. J. Hsieh, B. Klump, K. Holzmann, F. Borchard, M. Gregor, and R. Porschen. (1998). Hypermethylation of the p16INK4a promoter in colectomy specimens of patients with long-standing and extensive ulcerative colitis. Cancer Research.
J. M. Wheeler, H. C. Kim, J. A. Efstathiou, M. Ilyas, N. J. Mortensen, and W. F. Bodmer. (2001). Hypermethylation of the promoter region of the e-cadherin gene (CDH1) in sporadic and ulcerative colitis associated colorectal cancer. Gut. https://doi.org/10.1136/gut.48.3.367.
Timothy R. Church, Michael Wandell, Catherine Lofton-Day, and others. (2014). Prospective evaluation of methylated SEPT9 in plasma for detection of asymptomatic colorectal cancer. Gut. https://doi.org/10.1136/gutjnl-2012-304149.
E. A. Klein, D. Richards, A. Cohn, and others. (2021). Clinical validation of a targeted methylation-based multi-cancer early detection test using an independent validation set. Annals of Oncology. https://doi.org/10.1016/j.annonc.2021.05.806.
Stephen Cristiano, Alessandro Leal, Jillian Phallen, and others. (2019). Genome-wide cell-free DNA fragmentation in patients with cancer. Nature. https://doi.org/10.1038/s41586-019-1272-6.
Geert D’Haens, Orlaith Kelly, Robert Battat, and others. (2020). Development and validation of a test to monitor endoscopic activity in patients with crohn’s disease based on serum levels of proteins. Gastroenterology. https://doi.org/10.1053/j.gastro.2019.10.034.
Mahmoud H. Mosli, Guangyong Zou, Sushil K. Garg, and others. (2015). C-reactive protein, fecal calprotectin, and stool lactoferrin for detection of endoscopic activity in symptomatic inflammatory bowel disease patients: A systematic review and meta-analysis. American Journal of Gastroenterology. https://doi.org/10.1038/ajg.2015.120.